From the conversion glossary
Concepts referenced in this article, defined.
Concepts referenced in this article, defined.
Run rigorous A/B tests and personalize every visit on Shopify or any storefront — no engineers required.
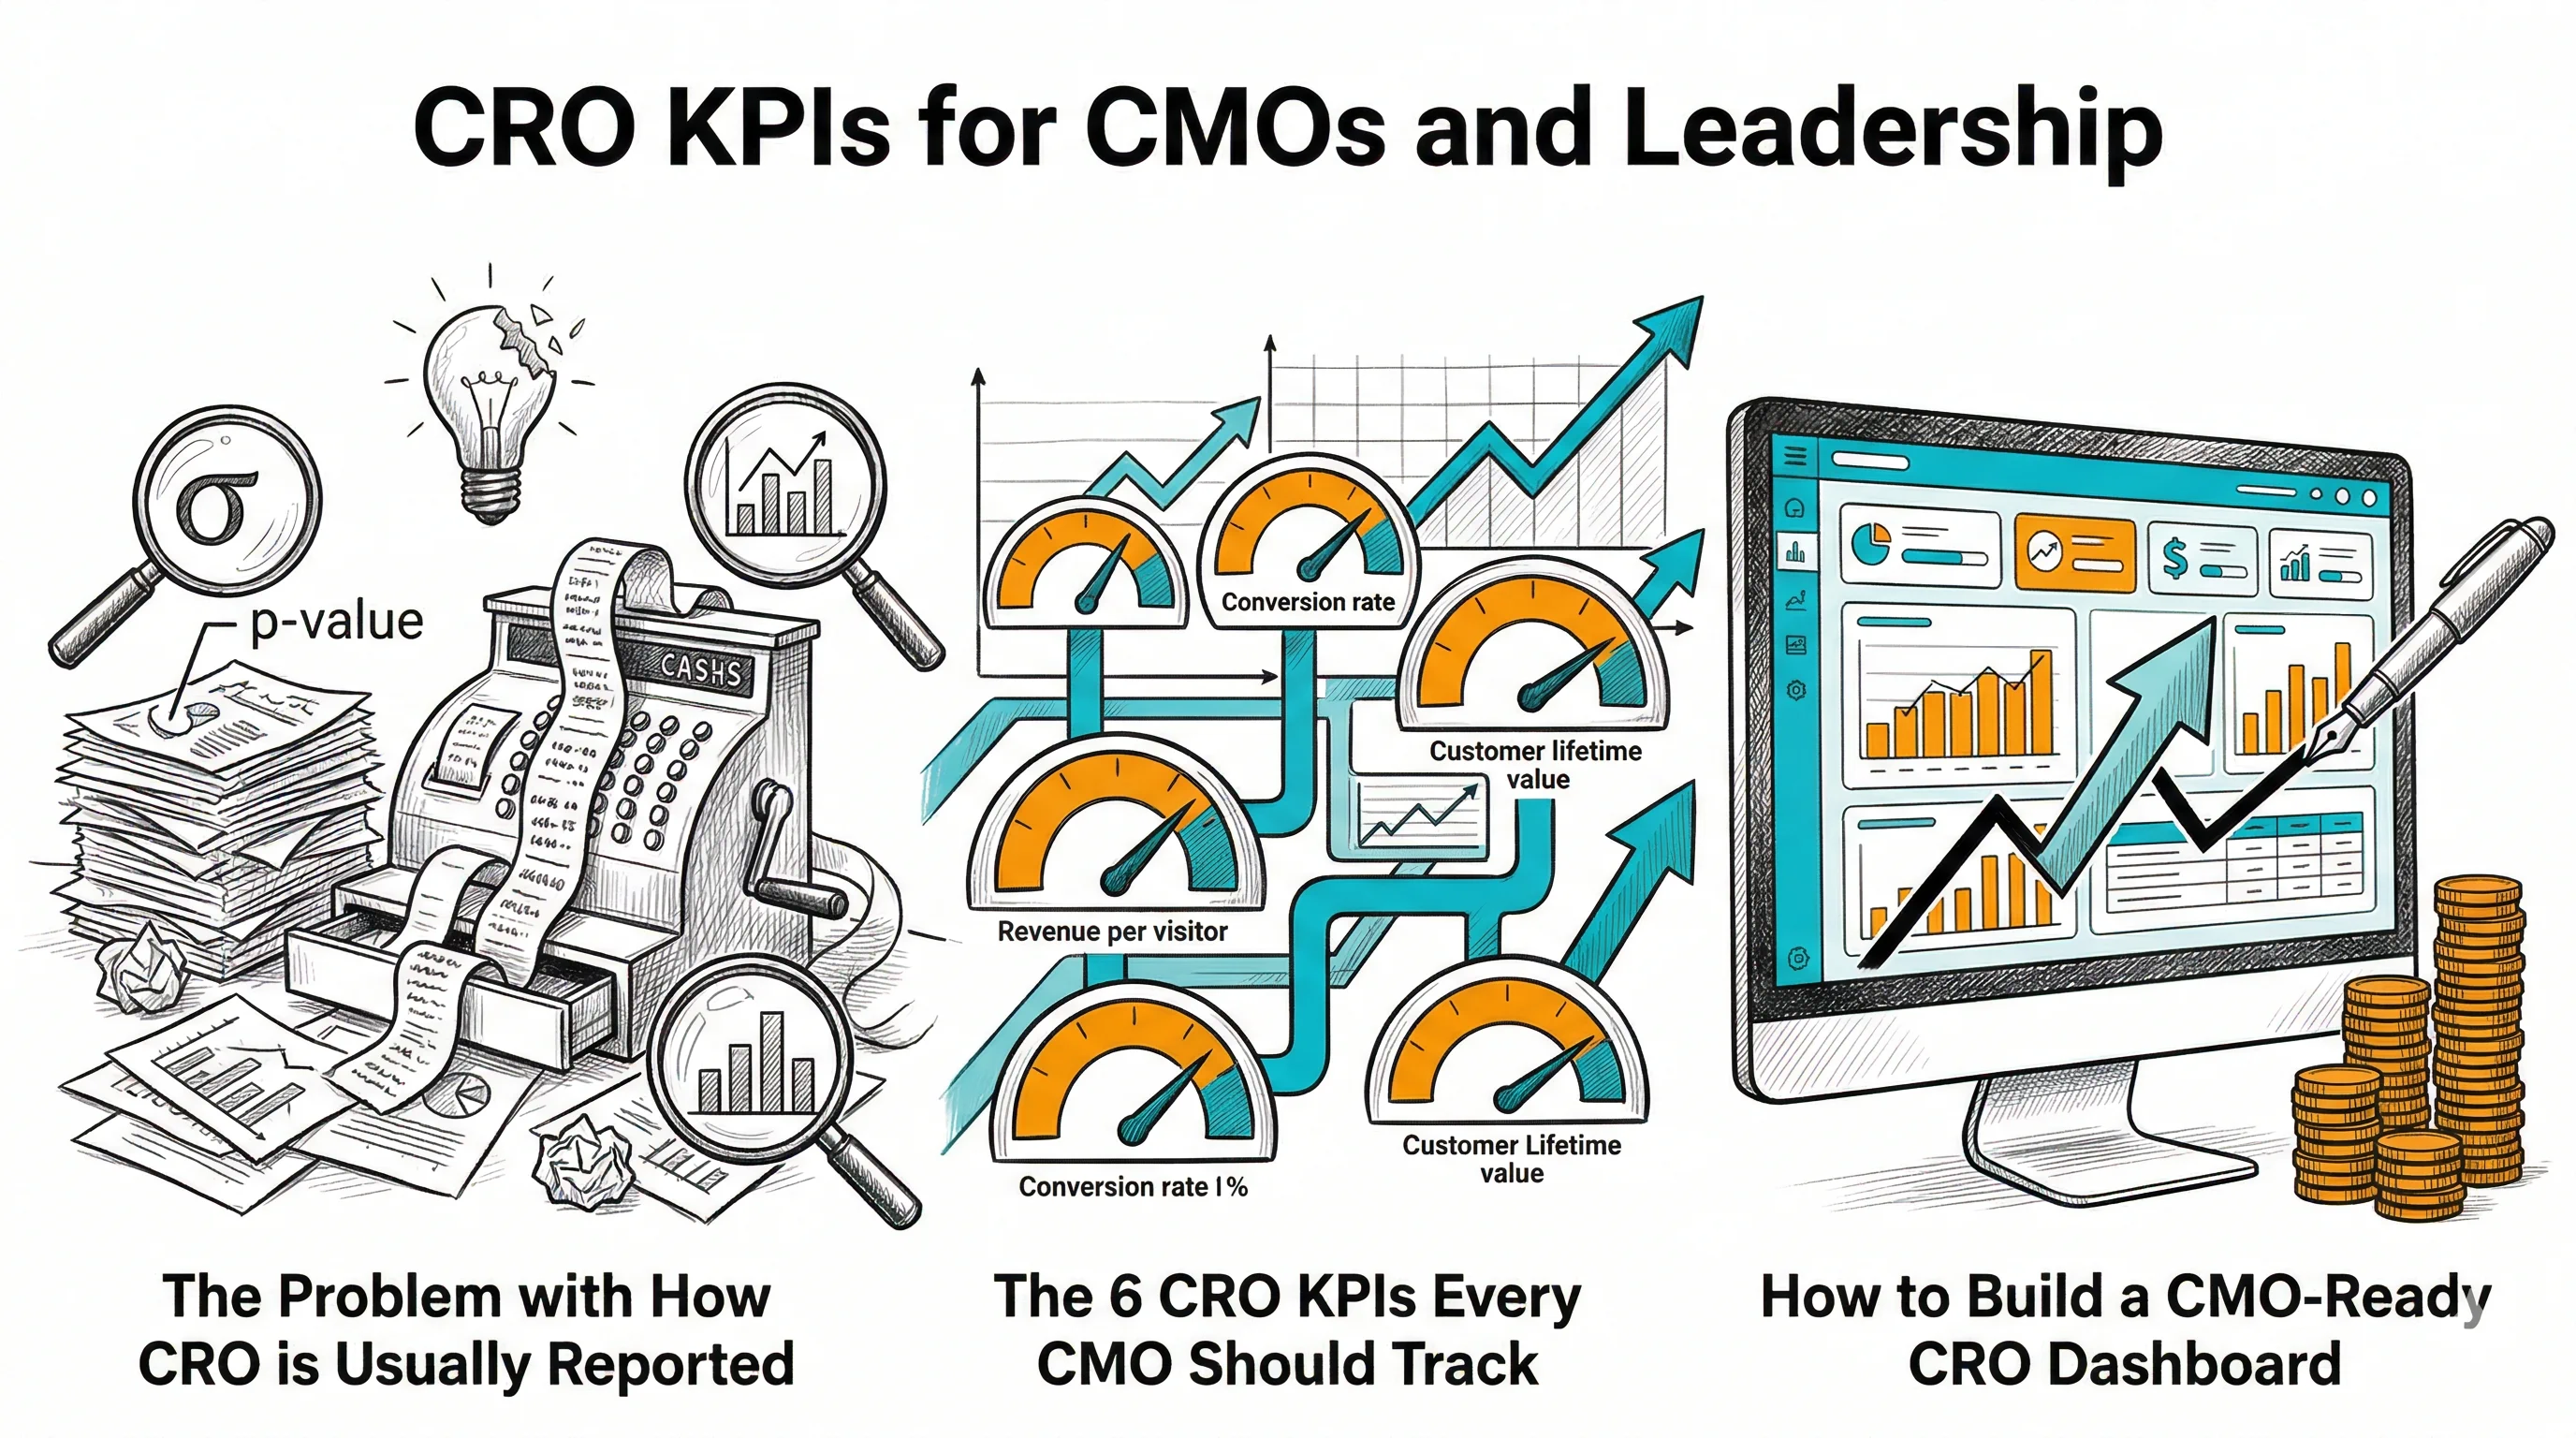
CRO teams track dozens of metrics. CMOs and leadership need five or six that tell a clear story about whether the conversion program is working and how much money it's making. This guide covers the right CRO KPIs for leadership review — and how to present them in a way that connects optimization to revenue.
Most CRO teams report on test results: "Test A won with 15% CVR lift at 95% confidence." That's technically accurate but strategically useless for a CMO trying to understand whether the CRO program is worth continued investment.
Leadership-level CRO reporting needs to answer three questions:
Everything else is execution detail.
Formula: Total Revenue ÷ Total Sessions
Why it's the best leadership metric: RPV combines conversion rate and average order value into a single number that directly measures website commercial effectiveness. You can have a rising CVR but falling AOV — and RPV captures both. It's also easy to benchmark and trend over time.
What good looks like: RPV should increase quarter over quarter as your CRO program matures. A well-run CRO program should improve RPV by 10-25% in year one.
Indian D2C benchmarks: RPV varies widely by category. Wellness brands typically see ₹15-40 RPV. Fashion D2C is often ₹8-25 RPV. Track your own baseline and improve from there.
Formula: Total Orders ÷ Total Sessions × 100
Why it matters: The headline number. But leadership should also see CVR broken down by key funnel stages:
A drop in any one stage pinpoints where the biggest optimization opportunity exists.
What good looks like: Indian D2C brands typically see 0.8–1.5% overall CVR. Structured CRO programs typically push this to 1.5–2.5%. Category leaders see 3%+.
Formula: (Winning CVR – Control CVR) × Monthly Sessions × 12 × Average Order Value
Why it matters: This translates your A/B test results into revenue language. Every winning test has a revenue value. Leadership should see this cumulatively — how much incremental annual revenue did this quarter's tests generate?
Example: A test that improves product page CVR from 3.2% to 3.6% on a page receiving 20,000 monthly visitors, with a ₹1,400 AOV, generates: (0.036 - 0.032) × 20,000 × 12 × ₹1,400 = ₹13,44,000 annual incremental revenue
What good looks like: At a healthy CRO program, annual estimated revenue impact of winning tests should be 5-15x the annual CRO program cost.
See also: Conversion Rate Optimization glossary | A/B Testing glossary | Conversion Funnel glossary
Formula: Count of new A/B tests launched in the period
Why it matters: CRO is a volume game. Brands that run more tests learn faster and compound wins. Low velocity is a process or resource problem — and leadership should know about it.
What good looks like by maturity level:
If velocity is consistently below target, the root cause is usually: hypotheses aren't getting prioritized, design/development is bottlenecking test setup, or the testing tool requires too much technical involvement.
No-code tools like CustomFit.ai address the last point — tests can be launched without developer involvement, which is the most common velocity bottleneck.
Formula: Winning Tests ÷ Total Tests Concluded × 100
Why it matters: Win rate reflects hypothesis quality. Low win rate = weak research and hypothesis formation. High win rate = you're only testing very safe ideas (which limits upside).
What good looks like: 30-40% win rate is healthy. Below 20% — invest in better qualitative research. Above 55% — take more ambitious test ideas from your backlog.
How to use it: Win rate alone is misleading. A program running 20 tests/month at 30% win rate generates more winners than one running 5 tests/month at 50%. Report win rate alongside test velocity.
Formula: Total Estimated Revenue Impact of Tests ÷ Total Tests Run
Why it matters: This normalizes the revenue impact of your CRO program by the number of experiments run. It tells leadership how efficient the testing program is. A mature program with good hypothesis quality should produce higher revenue per experiment over time.
What good looks like: This varies enormously by brand size. A useful benchmark is that your CRO program should produce > ₹2-5x the monthly program cost in estimated revenue per winning test.
See also: Bounce Rate glossary | Session Recording glossary | Heatmap glossary
Recommended cadence: Monthly report for leadership, weekly for CRO team.
What to include in the monthly leadership report:
Keep the leadership report to 1 page or one slide deck of 5-6 slides. CRO teams sometimes over-report — executives want the commercial story, not the statistical methodology.
P-values and confidence intervals: Report "won at 95% confidence" — don't explain the statistics. Leadership trusts you to handle the methodology.
Every individual test result: Summarize by time period. Ten test results in a slide is a data dump, not a leadership briefing.
Vanity micro-metrics: Click-through rate on a button variant is not a CMO-level KPI. Revenue impact is.
Uplifts without baseline: "We improved by 15%" means nothing without the starting CVR and the revenue value of that improvement.
Frame CRO goals as revenue targets, not metric targets.
Instead of: "We will improve CVR by 15% this quarter."
Use: "Our CRO program will generate ₹40 Lakhs in incremental annual revenue from winning tests this quarter."
Both might be equivalent, but the second framing connects directly to the P&L — which is what leadership evaluates.
Reasonable first-year targets for a new CRO program: