From the conversion glossary
Concepts referenced in this article, defined.
Concepts referenced in this article, defined.
Run rigorous A/B tests and personalize every visit on Shopify or any storefront — no engineers required.
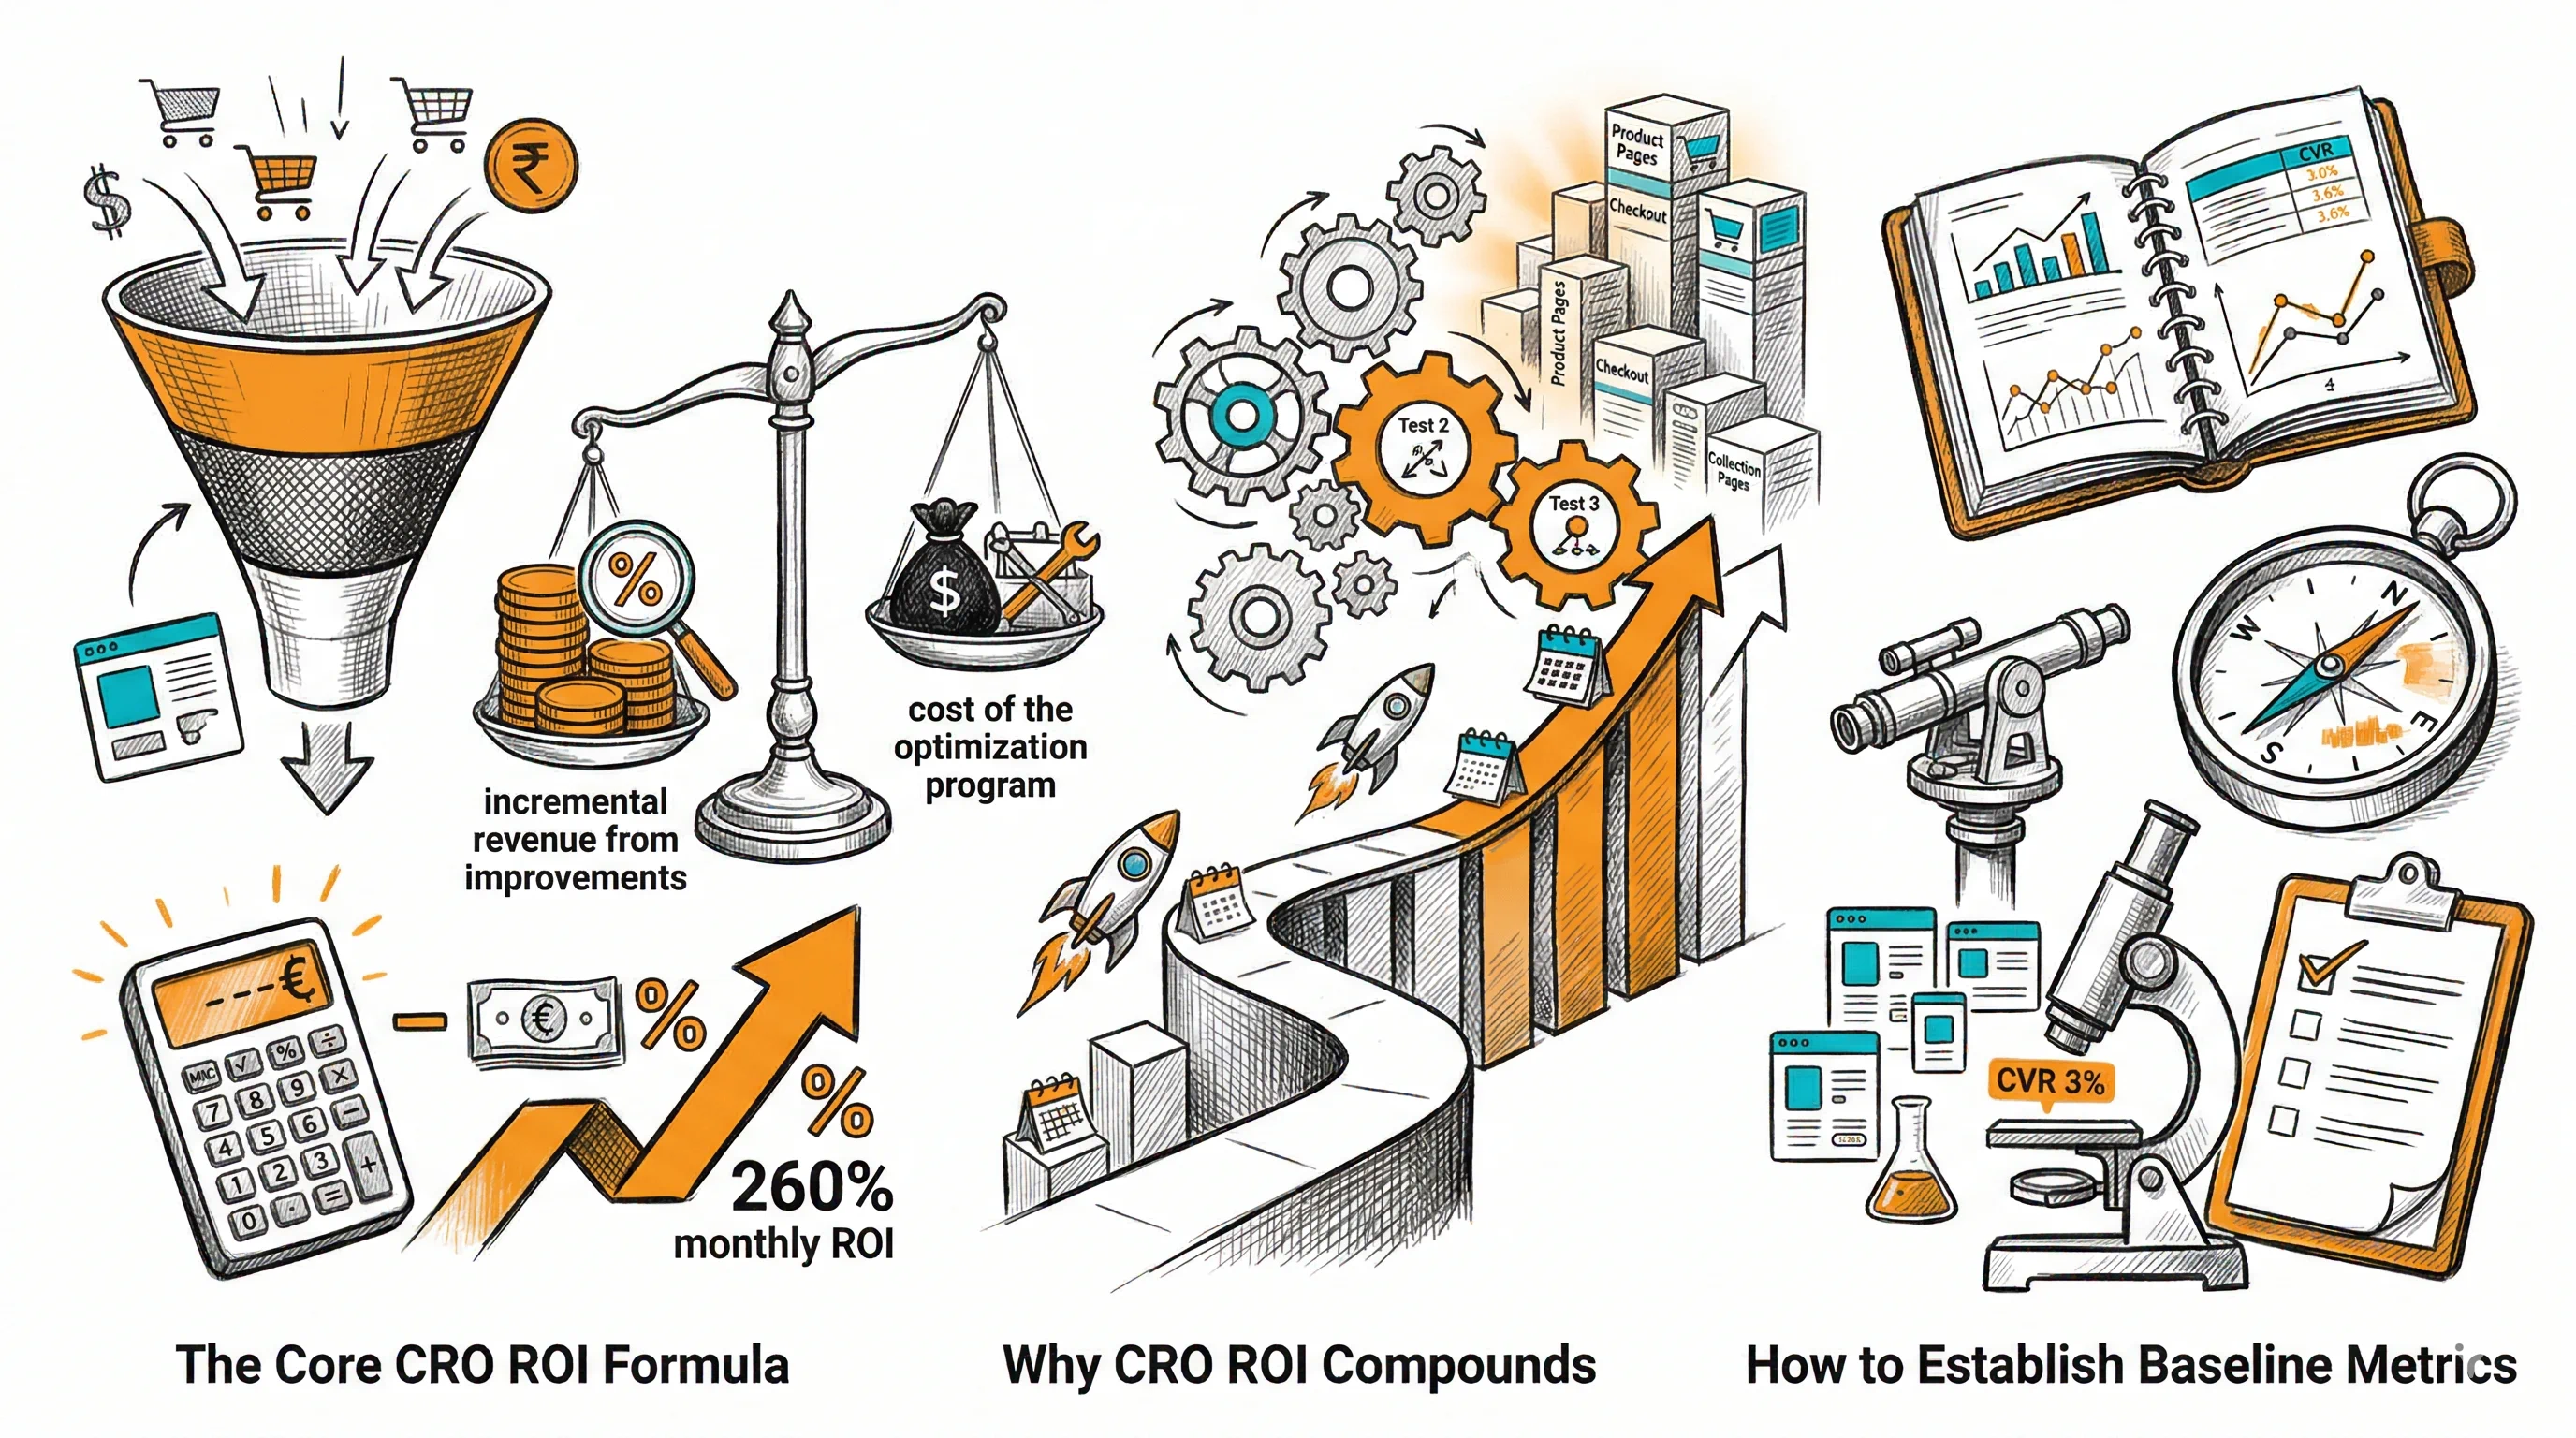
The ROI of a CRO program is calculated as incremental revenue generated by conversion improvements minus the cost of the optimization program. A single product page test that lifts CVR from 3% to 3.6% on a page receiving 5,000 monthly visitors at ₹1,200 AOV generates ₹36,000 in additional monthly revenue — from the same traffic, with no additional ad spend. Against a ₹10,000/month CRO tool investment, that's a 260% monthly ROI from a single test. Understanding how to calculate, track, and communicate this value is essential for maintaining organizational support for CRO programs.
This guide gives you the exact formulas, a practical measurement framework, and a reporting approach for proving CRO value to stakeholders who think in revenue terms, not in conversion rate percentages.
CRO ROI = (Incremental Revenue - CRO Investment) / CRO Investment × 100
Incremental Revenue = (New CVR - Baseline CVR) × Monthly Visitors × AOV
Example:
Incremental Revenue = (3.6% - 3.0%) × 5,000 × ₹1,200 = 0.006 × 5,000 × 1,200 = ₹36,000/month
CRO Investment (monthly):
CRO ROI = (₹36,000 - ₹20,199) / ₹20,199 × 100 = 78% monthly ROI
Over 12 months, this single test generates ₹4,32,000 in incremental revenue against a ₹2,42,388 investment — a 78% annual ROI. And this assumes you only run one successful test, which is a very conservative assumption.
The power of CRO is that each successful test improvement is permanent. Unlike paid advertising where you stop spending and traffic stops, a conversion rate improvement compounds:
Month 1: Test wins. CVR goes from 3% to 3.6%. Monthly revenue impact: ₹36,000. Month 2: Same improvement. Plus you've launched a new test on the category page. Month 3: Category page test wins. Now you have improvements on two pages. Monthly incremental revenue: ₹36,000 + ₹22,000 = ₹58,000. Month 6: Four winning tests across product page, category page, cart, and checkout. Monthly incremental revenue: ₹1,20,000+.
This compounding is why mature CRO programs generate 5–10× ROI — each winning test adds to a permanent baseline improvement, and running costs don't increase proportionally.
Before you can measure CRO ROI, you need clean baseline data. This is often the most neglected step.
Step 1: Define your conversion events Decide what "conversion" means for each page type:
Don't use site-wide metrics for page-level CRO ROI. Calculate at the page level.
Step 2: Pull 60–90 days of historical data Use Shopify's analytics or GA4 to get:
Step 3: Document and freeze the baseline Write these numbers down with the date range they represent. This is your measurement baseline. All future ROI calculations compare against it.
Step 4: Account for seasonality If your business has strong seasonal patterns (Diwali spike, summer dip), compare equivalent periods. A Holi-season baseline compared against a post-Holi period will show false "declines" that aren't due to CRO.
For every A/B test, document:
Pre-test:
Post-test (when test reaches significance):
30 days after rollout:
This documentation creates an evidence log that proves the cumulative value of your CRO program over time.
A simple dashboard for reporting CRO ROI to stakeholders:
| Metric | Value |
|---|---|
| Tests run (quarter) | 8 |
| Tests with significant positive result | 3 |
| Tests with neutral/negative result | 5 |
| Cumulative CVR improvement (active pages) | +1.4 percentage points |
| Monthly incremental revenue (estimated) | ₹82,000 |
| Quarterly CRO investment (tool + team) | ₹60,000 |
| Quarterly incremental revenue | ₹2,46,000 |
| CRO ROI (quarterly) | 310% |
Include this in monthly leadership reports. The "tests with neutral/negative result" number is important — it shows the program is running real experiments, not just implementing assumed winners.
Mistake 1: Claiming all revenue improvement as CRO impact If your revenue increased 20% and you ran CRO tests, not all of that is attributable to CRO. Isolate CRO impact by comparing CVR before and after specific tests, controlling for traffic volume and seasonality.
Mistake 2: Not accounting for test failures Only winning tests contribute to CRO ROI. If you run 10 tests and 4 win, your ROI calculation should account for the investment in all 10 tests, not just the 4 winners.
Mistake 3: Ignoring diminishing returns Once you've run 20+ tests on a page, incremental lift from each new test gets smaller. A mature product page tested 15 times might only yield 3–5% improvement from the next test. ROI expectations should adjust over time.
Mistake 4: Forgetting tool and team costs The ROI calculation must include:
For no-code tools like CustomFit.ai, the developer cost is eliminated — which is why the ROI calculation for CustomFit.ai-powered programs is typically higher than for developer-dependent tools.
When presenting CRO results to founders, investors, or leadership teams who don't know what "statistical significance" means, translate everything into revenue language:
Instead of: "Our CTA test achieved 97% statistical significance with a 20% relative CVR lift."
Say: "We tested two versions of our checkout button. One version generated ₹28,000 more revenue in 3 weeks on the same traffic. We're rolling this out to all visitors."
Instead of: "Our 90-day CRO program has run 6 significant experiments with a 1.2 percentage point CVR improvement."
Say: "Our 3-month optimization program is generating approximately ₹65,000 more revenue every month than we were making before — from the same ad spend and traffic."
The language of revenue impact makes CRO value undeniable to non-technical stakeholders.
What should you expect from your CRO program?
| Program Stage | Tests/Month | Expected CVR Lift/Year | Monthly Incremental Revenue (₹50L baseline) |
|---|---|---|---|
| Starting out (0–3 months) | 1–2 | 1–3% relative | ₹25,000–₹75,000 |
| Active program (3–12 months) | 3–5 | 10–25% relative | ₹2,50,000–₹6,25,000 |
| Mature program (12+ months) | 5–10 | 20–40% cumulative | ₹5,00,000–₹10,00,000+ |
These ranges assume well-formed hypotheses, proper statistical methods, and full rollout of winning tests. Brands like Bellavita (11% CVR improvement) and Kapiva (9.48% CVR improvement) fall within the active program range.
Establish your baseline before you run your first test — you can't calculate ROI without a known starting point.
Document every test outcome, including failures — a test that "fails" by showing a neutral result still has value (it disproves a hypothesis and saves you from shipping a change that doesn't help).
Calculate ROI at the page level, not site level — page-level ROI is more accurate and easier to attribute than site-wide CVR changes.
Run holdback tests after rollout — maintain 10–20% of traffic on the control for 2 weeks after rolling out a winner. This validates that the test result holds in production.
Present ROI quarterly, not monthly — monthly CRO ROI can be noisy. Quarterly aggregation smooths out test cadence variation and seasonality.
Track cumulative compounding value — show leadership the cumulative revenue impact of all winning tests over 12 months, not just the impact of the last test. The compounding story is compelling.
Related reading: CRO Roadmap: 90-Day Plan | CRO vs SEO | A/B Testing Metrics | Conversion Rate Optimization | CRO Pillar Guide