From the conversion glossary
Concepts referenced in this article, defined.
Concepts referenced in this article, defined.
Run rigorous A/B tests and personalize every visit on Shopify or any storefront — no engineers required.
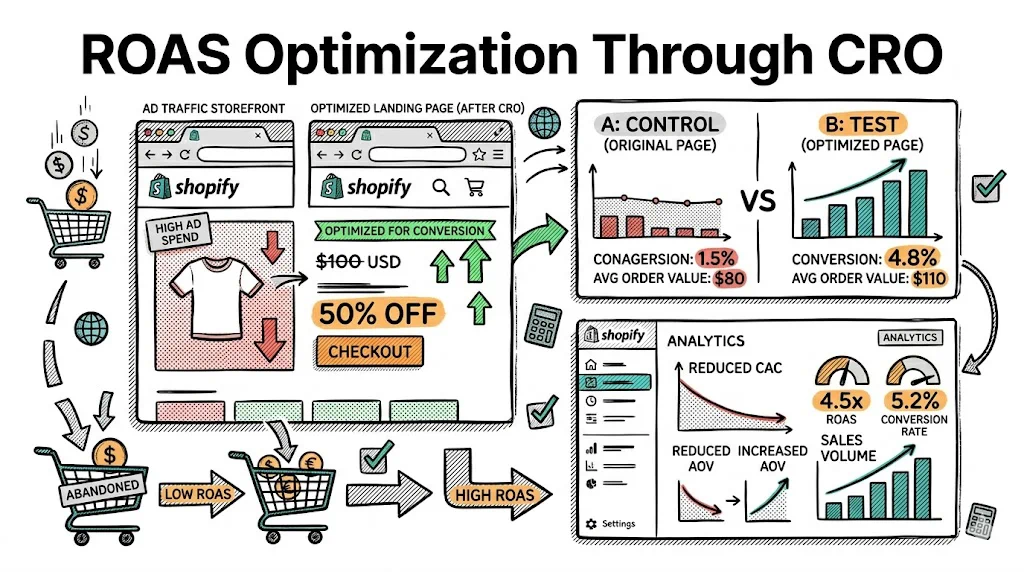
Return on Ad Spend (ROAS) has two sides: what you spend on ads, and the revenue those ads generate. Most D2C brands focus almost exclusively on the spending side — better targeting, smarter bidding, lower CPMs. The revenue side—what happens after the ad click—gets far less attention, even though improving it doesn't cost more ad budget. This guide explains how CRO (conversion rate optimization) directly lifts ROAS and which specific improvements have the biggest impact.
ROAS = Revenue / Ad Spend
If you spend ₹1,00,000 on Meta ads and generate ₹3,00,000 in revenue attributed to those ads, your ROAS is 3x.
Now look at the components:
Revenue = Sessions × Conversion Rate × Average Order Value
So: ROAS = (Sessions × CVR × AOV) / Ad Spend
Ad optimization (better targeting, lower CPMs) reduces the denominator or increases sessions. CRO improves CVR and AOV — both in the numerator. Improving CVR from 2% to 2.4% while holding everything else constant increases revenue by 20% and ROAS by 20%, without spending a single additional rupee on ads.
The leverage from CRO is often higher than from ad optimization because:
The most common ROAS destroyer: your ad promises one thing and your landing page delivers another.
Common mismatches:
Every mismatch is a conversion leak. The visitor who clicked your ad was primed by specific messaging. When the landing page doesn't continue that story, they leave. You paid for the click; you got nothing.
Fix: Create dedicated landing pages for each major campaign theme. An ad set targeting first-time buyers gets a page built for first-time buyers (brand story, bestsellers, trust signals, low entry price). An ad set targeting repeat purchasers gets a page built for them (new launches, subscription offer, loyalty benefits).
CustomFit.ai lets you serve different landing experiences based on UTM parameters — the same URL can show different content to visitors from different campaigns, without building separate pages.
Indian paid traffic is predominantly mobile. If your paid ads are driving mobile traffic to a checkout that converts at 0.8% on mobile vs. 2.2% on desktop, you have a mobile-specific ROAS problem that no amount of campaign optimization will fix.
Common mobile checkout friction points:
Fix: Run your entire mobile checkout flow on a real device monthly. Use GA4 to compare mobile vs. desktop conversion rates at each checkout step to identify specific drop-off points.
Paid traffic brings cold visitors — they don't know your brand. Unlike organic search visitors who may have done research, paid traffic often has its first brand contact at the point of ad view. Your product page needs to do more work for cold traffic.
What cold paid traffic needs:
Fix: Use behavioral tools (heatmaps, session recordings) specifically on paid traffic sessions. Look at what cold visitors actually engage with vs. what you've placed prominently. Test variants optimized for cold traffic intent.
Personalize the landing experience based on which audience segment clicked your ad:
This personalization consistently lifts ROAS 15–30% compared to sending all paid traffic to the same page.
See how CustomFit.ai personalizes landing pages for paid traffic →
Every 1% improvement in checkout completion rate has a direct 1%+ ROAS impact. For paid traffic where checkout completion is the only event that matters:
High-impact checkout tests:
Higher AOV = higher ROAS without changing anything about your campaigns. Two effective approaches:
Bundle upsells: After a visitor adds a product to cart, show a bundle (Product A + complementary Product B at 15% discount). If 20% of visitors take the bundle and it increases AOV by ₹400, your ROAS improves proportionally.
Threshold-based free shipping: "Add ₹250 more for free shipping" displayed in the cart when the visitor is close to the threshold. A significant portion of visitors will add an item to qualify. This reliably lifts AOV by 8–15% with minimal friction.
Chargebee, a B2B SaaS brand, saw 40% AOV lift through behavioral targeting. For D2C, the same logic applies — showing the right add-on to the right customer at the right moment in the purchase flow.
Page speed has a direct, measurable impact on ROAS for paid traffic. Studies consistently show:
For paid traffic, which is often the first touchpoint with your brand, slow pages are especially damaging — cold visitors have no brand loyalty to overcome the frustration.
Quick wins:
A data loop should connect your ad campaigns to your CRO program:
CRO and paid media are most powerful when they share data and inform each other's decisions.
One reason brands over-invest in ad optimization: they're looking at platform-reported ROAS, which is unreliable.
Meta reports ROAS using a 7-day click, 1-day view attribution window by default. This means:
Your actual ROAS is always lower than what ad platforms report. Use Shopify's actual revenue data as the source of truth. Divide actual revenue (minus returns) by actual ad spend for a realistic ROAS picture.
With accurate ROAS measurement, CRO improvements become visible and quantifiable — which helps justify investment in testing.