CustomFit.ai โ€” Website personalization, A/B testing and CRO for Shopify and D2C
Product
Features
โœฑ
Website Personalization
Adapt to each visitor's behavior & intent
โง–
A/B & Multivariate Testing
Rigorous experimentation
โœจ
AI CopilotNEW
Personalize with a prompt
๐Ÿค–
AI WingmanNEW
Auto-optimize toward winners
๐ŸŽฏ
AI Conversion OptimizerNEW
GPT-grade test ideas
โœŽ
No-Code Visual Editor
Drag-and-drop edit any element
โ–ฆ
Product Recommendations
Personalized recs that lift AOV
โš‘
Feature Flags
Ship safely with kill-switches
โ—ง
Chrome Extension
Edit your store in the browser
โง‰
Shopify, WooCommerce & more
All platform integrations
View all features โ†’
Use Cases
$
Price A/B Testing
Test price points to maximize revenue
โ–ฆ
Theme A/B Testing
Compare whole layouts & designs
๐Ÿ—‚
Template A/B Testing
Test whole PDP/PLP templates
๐Ÿท
Discount A/B Testing
Find the offer that converts
๐Ÿšš
Shipping A/B Testing
Thresholds, speed & copy
โœ
Content A/B Testing
Copy, images & reviews
๐Ÿ’ณ
Checkout Gateway A/B
Payments & one-click
โŒ–
Geo-Based Personalization
Per-location content & offers
โšก
Buyer-Intent Nudges
Exit-intent & retargeting
โ†”
Split-URL / Redirection
Full-page redirect tests
View all use cases โ†’
Solutions & Guides
โคข
Conversion Rate Optimization
The complete CRO guide
โง–
A/B Testing Software
Buyer's guide for D2C
๐Ÿ›’
Cart Abandonment Recovery
Win back lost carts
๐Ÿ“ฐ
Landing Page Optimization
Convert more paid traffic
S
Shopify A/B Testing
Test your store, no code
S
Shopify Personalization
Tailor the store per shopper
โ—”
First-Time Visitor Offers
Convert new shoppers with trust & offers
โ˜…
Repeat-Customer Experiences
Reward and re-engage loyal buyers
โ—Ž
Campaign-Matched Pages
Match the landing page to the ad
โŒ–
Location-Based Experiences
Currency, language & regional offers
Explore CRO โ†’
Customer stories
GIVA
+32%
conversion via personalized recs
GIVA
Mamaearth
+18%
revenue lift from PDP A/B tests
ME
The Sleep Company
+24%
AOV from product recommendations
TSC
Read customer stories โ†’
Integrations
SWsfGA+15
โœฆ
Not sure where to start?
Let AI Copilot pick your first tests

โ€œWe wake up to evidence-backed tests ready to deploy โ€” not a backlog of maybe ideas.โ€

AN
Anirudh S.
Growth ยท Chargebee
โ˜…โ˜…โ˜…โ˜…โ˜…4.8on G2 ยท 2,400+ brands
Talk to our team โ†’
Widgets
Integrations
Ecommerce & Checkout
Shopify
Shopline
Shoplazza
GoKwik
ShopFlo
Razorpay Magic Checkout
Breeze
Shiprocket
View all integrations โ†’
Analytics & Behavior
Google Analytics 4
Microsoft Clarity
Hotjar
Mixpanel
Amplitude
Heap
Adobe Analytics
Segment (CDP)
View all integrations โ†’
Engagement, CRM & More
Klaviyo
MoEngage
CleverTap
WebEngage
HubSpot
Salesforce
Slack
Meta Ads
View all integrations โ†’
CustomersPricing
Resources
CRO
โ–ค
Playbooks
Proven strategies to boost conversions
๐ŸŽ™
Interviews
D2C leaders & marketing experts
โ–ถ
Webinars
Live deep dives & product sessions
Learn
โœŽ
Blog
Tips, experiments & best practices
๐Ÿ“•
Free E-Books
Mastering personalization
๐Ÿ“–
Conversion Glossary
Every CRO term, defined
โœฆAI CopilotNEWLog inBook a demo
Start free trial
Select your platform โ€” Install in 2 minsWe'll tailor the setup
โšก Risk-free 14-day trial ยท No credit card ยท Cancel anytime
S
Shopify
Install from Shopify App Store
โ€บ
W
WooCommerce
Install the WooCommerce plugin
โ€บ
B
BigCommerce
Install from BigCommerce App Marketplace
โ€บ
SL
Shopline
Install from Shopline App Store
โ€บ
M
Salesforce / Magento
Install from the marketplace
โ€บ
SZ
Shoplazza
Install from Shoplazza App Store
โ€บ
WP
WordPress / Webflow
Install plugin or paste the script
โ€บ
โ—ง
Others
Custom-built on React, Next.js, etc.
โ€บ
Tip: pick your platform โ€” we handle the restBook a demo โ†’
Product
Website PersonalizationA/B & Multivariate TestingAI CopilotAI WingmanAI Conversion OptimizerNo-Code Visual EditorProduct RecommendationsFeature FlagsView all features โ†’
Use Cases
Price A/B TestingTheme A/B TestingTemplate A/B TestingDiscount A/B TestingShipping A/B TestingContent A/B TestingCheckout Gateway A/BGeo-Based PersonalizationBuyer-Intent NudgesSplit-URL / Redirection
Solutions & Guides
Conversion Rate OptimizationA/B Testing SoftwareCart Abandonment RecoveryLanding Page OptimizationShopify A/B TestingShopify Personalization
Explore
WidgetsIntegrationsCustomersPricing
Resources
BlogPlaybooksWebinarsInterviewsE-BooksConversion Glossary
Platforms
ShopifyShoplineShoplazzaChrome ExtensionAll integrations
Start free trialBook a demo
Homeโ€บBlogโ€บcroโ€บEcommerce Conversion Rate Benchmarks 2026

Ecommerce Conversion Rate Benchmarks 2026

SJSapna JoharHead of Growth & CRO, CustomFit.aiJanuary 15, 20258 min read
On this page
  1. Global Ecommerce Conversion Rate: 2026 Overview
  2. Benchmark Data by Ecommerce Category
  3. Beauty and Personal Care
  4. Health, Wellness, and Supplements
  5. Fashion and Apparel
  6. Consumer Electronics and Gadgets
  7. Food, Grocery, and D2C FMCG
  8. Conversion Rate by Device: 2026
  9. Conversion Rate by Traffic Source
  10. Conversion Rate Funnel Benchmarks
  11. Year-Over-Year Conversion Rate Trends
  12. Setting CVR Targets: A Practical Framework
  13. Related Articles
  14. Key Takeaways
0%
Ecommerce Conversion Rate Benchmarks 2026

From the conversion glossary

Concepts referenced in this article, defined.

Definition
What Is Lift? Definition, Formula & Guide
Definition
What Is Subscription? Definition & Guide
Definition
What Is Variant? Definition, Formula & Guide
Definition
What Is Baseline? Definition, Formula & Guide
Definition
What Is Core Web Vitals? Definition & Guide
โ† Back to Cro guide
Try CustomFit.ai

Run A/B tests and personalize your store without code. 14-day free trial, no credit card.

Start free trial โ†’
Share
XLinkedInEmail

Related articles

cro

CRO for D2C Brands: How to Increase Conversion Rate Without More Ad Spend

A practical guide to conversion rate optimization for direct-to-consumer brands โ€” covering product pages, checkout, homepage, and the full D2C funnel with real tactics that work.

Sapna Joharยท 5 min read
cro

Cart Abandonment Reduction: 12 Tactics That Actually Work

The average cart abandonment rate is 70%. Here are 12 proven tactics to recover more abandoned carts โ€” on-site interventions, email flows, and personalization strategies with real results.

Sapna Joharยท 6 min read
cro

When NOT to A/B Test: Decision Framework

Sapna Joharยท 7 min read

Start lifting conversions today.

Run rigorous A/B tests and personalize every visit on Shopify or any storefront โ€” no engineers required.

Start free trialBook a demo

Built for every D2C category

๐Ÿงด
Skincare
๐Ÿ’„
Beauty
๐ŸŒฟ
Wellness
โ˜•
F&B
๐Ÿ‘Ÿ
Apparel
๐Ÿ’
Jewelry
๐Ÿ›‹๏ธ
Home
๐Ÿผ
Baby
Live ยท Right now
Mamaearth โ€” free-shipping band +12.4% AOVGIVA โ€” festive collection page +34% revenueBellavita โ€” PDP CTA test +27.4% CVRKapiva โ€” Quiz-driven recs +9.48% CTRThe Sleep Co โ€” landing personalized 2ร— capturesPlum โ€” Returning shopper swap +18.2% CVRMamaearth โ€” free-shipping band +12.4% AOVGIVA โ€” festive collection page +34% revenueBellavita โ€” PDP CTA test +27.4% CVRKapiva โ€” Quiz-driven recs +9.48% CTRThe Sleep Co โ€” landing personalized 2ร— capturesPlum โ€” Returning shopper swap +18.2% CVR
Get in touch

Tell us about your store.

We reply within an hour during business hours. No sales pitch, no spam โ€” just answers from someone who's seen 2,400+ D2C stores.

โœ“ Reply within 1 hourโœ“ No spam, everโœ“ Free demo & setup help
โœ“ Thanks! We'll be in touch shortly.
CustomFit.ai

The all-in-one website personalization, A/B testing & CRO platform for high-growth D2C brands. Made by marketers, fueled by coffee.

in๐•โ—Žโ–ถf
Product
  • Features
  • A/B Testing
  • Personalization
  • AI Copilot
  • AI Wingman
  • AI Conversion Optimizer
  • Feature Flags
  • Widgets
  • Integrations
  • ROI Calculator
Platforms
  • Shopify
  • Shopline
  • Shoplazza
  • Salesforce
  • Chrome Extension
  • All Integrations
Resources
  • Blog
  • Playbooks
  • Webinars
  • GrowthFit Interviews
  • Free E-Books
  • Conversion Glossary
  • Case Studies
Compare
  • vs VWO
  • vs Optimizely
  • vs Google Optimize
  • vs Mutiny
  • vs Intelligems
  • vs Shoplift
  • vs AB Tasty
  • vs Convert
  • vs Kameleoon
Company
  • About Us
  • Partners
  • CustomFit Awards
  • Recognition
  • Contact
  • Privacy Policy
  • Terms & Conditions
ยฉ 2026 CustomFit.ai ยท Valley Monks Pvt Ltd ยท Made by marketers, fueled by coffee, and obsessed with conversions.
SOC 2 Type II ยท GDPR ยท CCPA ยท ISO 27001

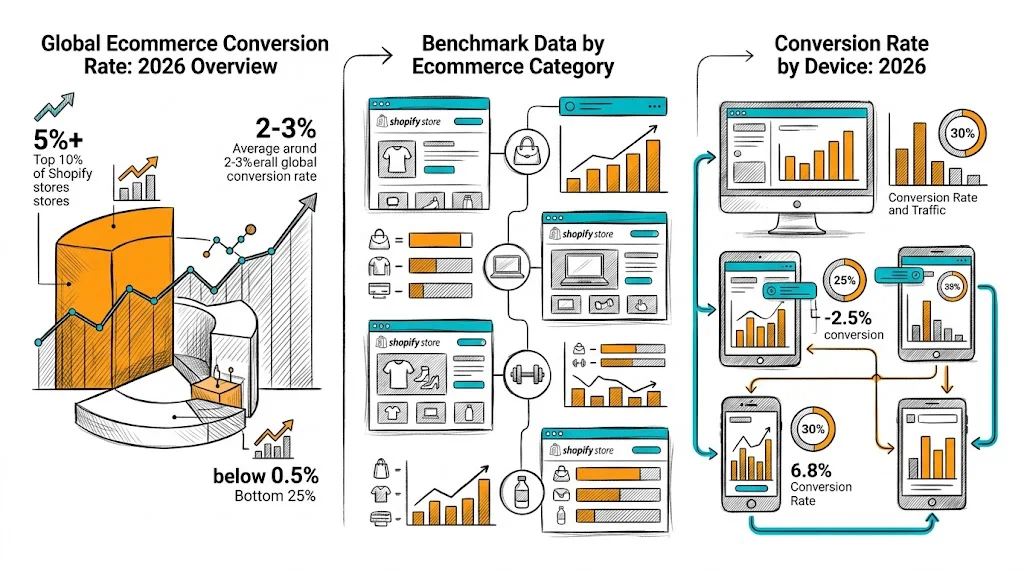
The global average ecommerce conversion rate in 2026 is approximately 2โ€“3%, but this single number conceals enormous variation: the top 10% of Shopify stores convert at 5%+, while the bottom 25% struggle to reach 0.5%. Understanding where your store sits relative to the right benchmark โ€” segmented by category, device, traffic source, and market โ€” is the starting point for any meaningful CRO program. This report compiles 2026 benchmark data across verticals with specific attention to Indian D2C brands on Shopify.

Global Ecommerce Conversion Rate: 2026 Overview

BenchmarkRate
Global ecommerce average2.5โ€“3%
Top 10% of stores5%+
Median Shopify store~1.4%
Mobile (global average)1.5โ€“2%
Desktop (global average)3โ€“4%
Email traffic4โ€“8%
Organic search traffic2โ€“4%

Key insight: The gap between median (1.4%) and top 10% (5%+) is massive. This gap is almost entirely explained by CRO program maturity โ€” top stores run continuous A/B testing programs, iterate rapidly, and compound improvements over time.

Benchmark Data by Ecommerce Category

Beauty and Personal Care

Beauty is one of the largest D2C categories in India, dominated by brands like Nykaa, Mamaearth, Plum, mCaffeine, and Sugar.

SegmentConversion Rate
Skincare (moisturizers, serums)2โ€“4%
Haircare (oils, shampoos)2.5โ€“4.5%
Color cosmetics1.5โ€“3.5%
Premium skincare (โ‚น1,000+)1โ€“2.5%
Mass beauty (โ‚น299 and below)3โ€“6%

What affects beauty CVR most:

  • Product image quality (lifestyle vs. plain background): up to 20% CVR difference
  • Review volume and recency: stores with 500+ recent reviews convert at 2โ€“3x stores with <50 reviews
  • Size/shade variant selection UX: complex variant menus can suppress CVR by 15โ€“25%

Health, Wellness, and Supplements

Health and Ayurveda brands (Kapiva, Dabur's D2C, Himalaya D2C, Oziva) see some of the highest CVRs in Indian ecommerce when they get content right.

SegmentConversion Rate
Ayurvedic products2.5โ€“4%
Sports supplements2โ€“3.5%
Weight management2โ€“4%
Vitamins and general wellness2.5โ€“4.5%
Medical devices (BP monitors, etc.)1โ€“2%

Kapiva achieved a 9.48% CVR lift through product page optimization with CustomFit.ai โ€” starting from a 2.8% baseline, moving to 3.06%.

Fashion and Apparel

Fashion has among the lowest CVRs due to the high consideration cycle (sizing concerns, fit uncertainty) but significant opportunity to improve through size guide testing, fit visualization, and returns policy prominence.

SegmentConversion Rate
Men's apparel1โ€“2.5%
Women's apparel1โ€“2.5%
Ethnic wear1.5โ€“3%
Footwear1.5โ€“2.5%
Accessories (bags, belts)2โ€“3.5%
Athleisure/sportswear1.5โ€“3%

What moves fashion CVR most:

  • Free returns policy prominently displayed: 5โ€“15% CVR lift
  • Size guide integration on product page: 8โ€“12% CVR lift
  • Model size information: "Model is 5'7" wearing Size M" โ€” reduces return-rate anxiety

Consumer Electronics and Gadgets

Electronics has the lowest ecommerce CVR due to high consideration, price sensitivity, and strong preference to compare across platforms before buying.

SegmentConversion Rate
Smartphones and accessories0.5โ€“1.5%
Audio (headphones, speakers)1โ€“2%
Small appliances1โ€“2.5%
Fitness wearables1โ€“2%
Computer peripherals1.5โ€“2.5%

Brands like Boat improve CVR through detailed comparison tables (vs. competitors), video demonstrations, and EMI display for products above โ‚น2,000.

Food, Grocery, and D2C FMCG

Food and grocery D2C is the highest-converting ecommerce category when done right โ€” consumables with strong brand loyalty and subscription models drive repeat purchase CVR above 10%.

SegmentConversion Rate
Healthy snacks3โ€“6%
Specialty food2.5โ€“5%
Coffee and tea3โ€“7%
Subscription food boxes5โ€“10%
Organic produce2โ€“4%

Conversion Rate by Device: 2026

DeviceGlobal AverageIndia Average
Desktop3.5โ€“4.5%3โ€“4%
Tablet2.5โ€“3.5%2โ€“3%
Mobile1.5โ€“2.5%1โ€“2%

The mobile CVR gap is the defining challenge for Indian D2C brands. With 75โ€“85% of Indian ecommerce traffic on mobile devices, improving mobile CVR from 1.5% to 2% on 100,000 monthly sessions adds 500 additional purchases per month โ€” at โ‚น699 AOV, that's โ‚น3.5L additional monthly revenue.

What drives the mobile-desktop gap:

  1. Smaller screens make trust signals and product details harder to absorb
  2. Mobile checkout forms create more friction
  3. Mobile page load speeds are slower, especially on 4G in Tier 2 cities
  4. Product images that look compelling on desktop may be too small to evaluate on mobile

Mobile CVR improvement tactics (test these with CustomFit.ai):

  • Sticky "Add to Cart" button visible without scrolling
  • Simplified mobile checkout (fewer form fields)
  • Faster image loading (WebP format, lazy loading)
  • Pincode-first address form for Indian mobile users
  • UPI and COD options displayed prominently on mobile checkout

Conversion Rate by Traffic Source

Traffic SourceIndia CVR Range
Direct traffic3โ€“6%
Email (subscribers)4โ€“8%
Organic search2โ€“4%
Branded paid search3โ€“6%
Google Shopping1.5โ€“3%
Facebook/Instagram (retargeting)2โ€“4%
Facebook/Instagram (cold)0.5โ€“2%
YouTube (retargeting)1.5โ€“3%
Influencer traffic0.5โ€“3%
WhatsApp marketing3โ€“7%

WhatsApp as a high-CVR channel: Indian D2C brands like Mamaearth and The Man Company are achieving 5โ€“7% CVR from WhatsApp marketing campaigns โ€” above email in many cases โ€” due to the platform's high open and response rates in India.

Conversion Rate Funnel Benchmarks

Beyond top-line CVR, track your conversion funnel:

Funnel StageBenchmarkPoor Performance
Visit โ†’ Product Page View40โ€“60%<30%
Product Page View โ†’ Add to Cart8โ€“15%<5%
Add to Cart โ†’ Checkout Start60โ€“75%<50%
Checkout Start โ†’ Purchase65โ€“80%<55%
Overall Visit โ†’ Purchase2โ€“4%<1%

If your add-to-cart rate is good (10%+) but checkout completion is low (55%), your problem is in the checkout experience โ€” not the product pages. This funnel analysis directs optimization effort to the right place.

Year-Over-Year Conversion Rate Trends

2026 ecommerce CVR trends vs. 2024:

TrendDirectionImpact
Mobile CVR improvementUp +8โ€“12%Brands investing in mobile UX are winning
AI personalization adoptionUp 30%Brands using personalization see 15โ€“20% CVR lifts
Page speed improvementsUpCore Web Vitals improvements translate to CVR
COD decline in metrosDown for CODPrepaid CVR rising in Tier 1 cities
WhatsApp commerceUp significantlyNew high-CVR channel for Indian D2C
Influencer effectivenessMixedNano/micro-influencer CVR rising; mega-influencer declining

Setting CVR Targets: A Practical Framework

Step 1: Calculate current CVR (90-day period) Step 2: Segment by device, traffic source, new vs. returning Step 3: Compare to industry benchmarks above Step 4: Identify your biggest gap (e.g., mobile CVR is 40% below benchmark) Step 5: Set quarterly improvement target (5โ€“15% relative improvement per quarter is realistic with active testing) Step 6: Run A/B tests with CustomFit.ai to close the gap Step 7: Review monthly, adjust quarterly

Realistic CVR improvement trajectory:

YearCVR (Beauty brand example)Method
Starting point1.8%Pre-CRO
Q1 after CRO program2.0%Mobile CTA tests
Q22.3%Product image + price display tests
Q32.6%Checkout optimization
Q42.9%Personalization layer

From 1.8% to 2.9% is a 61% relative improvement in 12 months โ€” the equivalent of getting 61% more revenue from the same traffic.

Related Articles

  • Good Conversion Rate by Industry: 2026 Benchmarks โ€” Category-specific guidance
  • How to Calculate Conversion Rate โ€” Formula and segmentation
  • CRO Process: Step-by-Step Framework โ€” How to improve CVR systematically
  • 20 Proven CRO Strategies for Ecommerce โ€” Tactics library
  • Best A/B Testing Tools for Ecommerce โ€” Tools to drive CVR improvement
  • Bounce rate glossary ยท RPV glossary

Key Takeaways

  • Global average ecommerce CVR is 2โ€“3%; top 10% of Shopify stores achieve 5%+
  • Indian D2C benchmarks are 20โ€“30% lower than global averages due to mobile dominance and COD usage
  • Mobile CVR (1โ€“2%) is half of desktop CVR (3โ€“4%) โ€” with 75โ€“85% of Indian traffic on mobile, this is the biggest opportunity
  • WhatsApp marketing is achieving 5โ€“7% CVR for Indian D2C brands โ€” higher than email in many cases
  • Track your conversion funnel (visit โ†’ add-to-cart โ†’ checkout start โ†’ purchase) to identify where you're losing visitors
  • Brands running systematic A/B testing programs see 10โ€“20% CVR improvements per quarter โ€” Bellavita achieved 11% lift, Kapiva 9.48% with CustomFit.ai