CustomFit.ai โ€” Website personalization, A/B testing and CRO for Shopify and D2C
Product
Features
โœฑ
Website Personalization
Adapt to each visitor's behavior & intent
โง–
A/B & Multivariate Testing
Rigorous experimentation
โœจ
AI CopilotNEW
Personalize with a prompt
๐Ÿค–
AI WingmanNEW
Auto-optimize toward winners
๐ŸŽฏ
AI Conversion OptimizerNEW
GPT-grade test ideas
โœŽ
No-Code Visual Editor
Drag-and-drop edit any element
โ–ฆ
Product Recommendations
Personalized recs that lift AOV
โš‘
Feature Flags
Ship safely with kill-switches
โ—ง
Chrome Extension
Edit your store in the browser
โง‰
Shopify, WooCommerce & more
All platform integrations
View all features โ†’
Use Cases
$
Price A/B Testing
Test price points to maximize revenue
โ–ฆ
Theme A/B Testing
Compare whole layouts & designs
๐Ÿ—‚
Template A/B Testing
Test whole PDP/PLP templates
๐Ÿท
Discount A/B Testing
Find the offer that converts
๐Ÿšš
Shipping A/B Testing
Thresholds, speed & copy
โœ
Content A/B Testing
Copy, images & reviews
๐Ÿ’ณ
Checkout Gateway A/B
Payments & one-click
โŒ–
Geo-Based Personalization
Per-location content & offers
โšก
Buyer-Intent Nudges
Exit-intent & retargeting
โ†”
Split-URL / Redirection
Full-page redirect tests
View all use cases โ†’
Solutions & Guides
โคข
Conversion Rate Optimization
The complete CRO guide
โง–
A/B Testing Software
Buyer's guide for D2C
๐Ÿ›’
Cart Abandonment Recovery
Win back lost carts
๐Ÿ“ฐ
Landing Page Optimization
Convert more paid traffic
S
Shopify A/B Testing
Test your store, no code
S
Shopify Personalization
Tailor the store per shopper
โ—”
First-Time Visitor Offers
Convert new shoppers with trust & offers
โ˜…
Repeat-Customer Experiences
Reward and re-engage loyal buyers
โ—Ž
Campaign-Matched Pages
Match the landing page to the ad
โŒ–
Location-Based Experiences
Currency, language & regional offers
Explore CRO โ†’
Customer stories
GIVA
+32%
conversion via personalized recs
GIVA
Mamaearth
+18%
revenue lift from PDP A/B tests
ME
The Sleep Company
+24%
AOV from product recommendations
TSC
Read customer stories โ†’
Integrations
SWsfGA+15
โœฆ
Not sure where to start?
Let AI Copilot pick your first tests

โ€œWe wake up to evidence-backed tests ready to deploy โ€” not a backlog of maybe ideas.โ€

AN
Anirudh S.
Growth ยท Chargebee
โ˜…โ˜…โ˜…โ˜…โ˜…4.8on G2 ยท 2,400+ brands
Talk to our team โ†’
Widgets
Integrations
Ecommerce & Checkout
Shopify
Shopline
Shoplazza
GoKwik
ShopFlo
Razorpay Magic Checkout
Breeze
Shiprocket
View all integrations โ†’
Analytics & Behavior
Google Analytics 4
Microsoft Clarity
Hotjar
Mixpanel
Amplitude
Heap
Adobe Analytics
Segment (CDP)
View all integrations โ†’
Engagement, CRM & More
Klaviyo
MoEngage
CleverTap
WebEngage
HubSpot
Salesforce
Slack
Meta Ads
View all integrations โ†’
CustomersPricing
Resources
CRO
โ–ค
Playbooks
Proven strategies to boost conversions
๐ŸŽ™
Interviews
D2C leaders & marketing experts
โ–ถ
Webinars
Live deep dives & product sessions
Learn
โœŽ
Blog
Tips, experiments & best practices
๐Ÿ“•
Free E-Books
Mastering personalization
๐Ÿ“–
Conversion Glossary
Every CRO term, defined
โœฆAI CopilotNEWLog inBook a demo
Start free trial
Select your platform โ€” Install in 2 minsWe'll tailor the setup
โšก Risk-free 14-day trial ยท No credit card ยท Cancel anytime
S
Shopify
Install from Shopify App Store
โ€บ
W
WooCommerce
Install the WooCommerce plugin
โ€บ
B
BigCommerce
Install from BigCommerce App Marketplace
โ€บ
SL
Shopline
Install from Shopline App Store
โ€บ
M
Salesforce / Magento
Install from the marketplace
โ€บ
SZ
Shoplazza
Install from Shoplazza App Store
โ€บ
WP
WordPress / Webflow
Install plugin or paste the script
โ€บ
โ—ง
Others
Custom-built on React, Next.js, etc.
โ€บ
Tip: pick your platform โ€” we handle the restBook a demo โ†’
Product
Website PersonalizationA/B & Multivariate TestingAI CopilotAI WingmanAI Conversion OptimizerNo-Code Visual EditorProduct RecommendationsFeature FlagsView all features โ†’
Use Cases
Price A/B TestingTheme A/B TestingTemplate A/B TestingDiscount A/B TestingShipping A/B TestingContent A/B TestingCheckout Gateway A/BGeo-Based PersonalizationBuyer-Intent NudgesSplit-URL / Redirection
Solutions & Guides
Conversion Rate OptimizationA/B Testing SoftwareCart Abandonment RecoveryLanding Page OptimizationShopify A/B TestingShopify Personalization
Explore
WidgetsIntegrationsCustomersPricing
Resources
BlogPlaybooksWebinarsInterviewsE-BooksConversion Glossary
Platforms
ShopifyShoplineShoplazzaChrome ExtensionAll integrations
Start free trialBook a demo
Homeโ€บBlogโ€บcroโ€บConversion Rate: How to Calculate and Benchmark

Conversion Rate: How to Calculate and Benchmark

SJSapna JoharHead of Growth & CRO, CustomFit.aiJanuary 15, 20258 min read
On this page
  1. The Conversion Rate Formula
  2. What Counts as a "Conversion"?
  3. Sessions vs. Users: Which to Use?
  4. How to Find Your Conversion Rate in Shopify
  5. Conversion Rate Benchmarks by Category
  6. Segmenting Conversion Rate for Actionable Insights
  7. By Traffic Source
  8. By Device
  9. By New vs. Returning Visitors
  10. By City/Region
  11. Why Conversion Rate Alone Can Mislead
  12. How to Use Conversion Rate to Find Growth Opportunities
  13. Step 1: Establish your baseline
  14. Step 2: Identify the biggest gaps
  15. Step 3: Find the funnel drop-off point
  16. Step 4: Form a hypothesis
  17. Step 5: Run an A/B test
  18. Step 6: Iterate
  19. Conversion Rate and A/B Testing
  20. Related Articles
  21. Key Takeaways
0%
Conversion Rate: How to Calculate and Benchmark

From the conversion glossary

Concepts referenced in this article, defined.

Definition
What Is Lift? Definition, Formula & Guide
Definition
What Is Subscription? Definition & Guide
Definition
What Is Hypothesis? Definition & Guide
Definition
What Is Variant? Definition, Formula & Guide
Definition
What Is Baseline? Definition, Formula & Guide
โ† Back to Cro guide
Try CustomFit.ai

Run A/B tests and personalize your store without code. 14-day free trial, no credit card.

Start free trial โ†’
Share
XLinkedInEmail

Related articles

cro

CRO for D2C Brands: How to Increase Conversion Rate Without More Ad Spend

A practical guide to conversion rate optimization for direct-to-consumer brands โ€” covering product pages, checkout, homepage, and the full D2C funnel with real tactics that work.

Sapna Joharยท 5 min read
cro

Cart Abandonment Reduction: 12 Tactics That Actually Work

The average cart abandonment rate is 70%. Here are 12 proven tactics to recover more abandoned carts โ€” on-site interventions, email flows, and personalization strategies with real results.

Sapna Joharยท 6 min read
cro

When NOT to A/B Test: Decision Framework

Sapna Joharยท 7 min read

Start lifting conversions today.

Run rigorous A/B tests and personalize every visit on Shopify or any storefront โ€” no engineers required.

Start free trialBook a demo

Built for every D2C category

๐Ÿงด
Skincare
๐Ÿ’„
Beauty
๐ŸŒฟ
Wellness
โ˜•
F&B
๐Ÿ‘Ÿ
Apparel
๐Ÿ’
Jewelry
๐Ÿ›‹๏ธ
Home
๐Ÿผ
Baby
Live ยท Right now
Mamaearth โ€” free-shipping band +12.4% AOVGIVA โ€” festive collection page +34% revenueBellavita โ€” PDP CTA test +27.4% CVRKapiva โ€” Quiz-driven recs +9.48% CTRThe Sleep Co โ€” landing personalized 2ร— capturesPlum โ€” Returning shopper swap +18.2% CVRMamaearth โ€” free-shipping band +12.4% AOVGIVA โ€” festive collection page +34% revenueBellavita โ€” PDP CTA test +27.4% CVRKapiva โ€” Quiz-driven recs +9.48% CTRThe Sleep Co โ€” landing personalized 2ร— capturesPlum โ€” Returning shopper swap +18.2% CVR
Get in touch

Tell us about your store.

We reply within an hour during business hours. No sales pitch, no spam โ€” just answers from someone who's seen 2,400+ D2C stores.

โœ“ Reply within 1 hourโœ“ No spam, everโœ“ Free demo & setup help
โœ“ Thanks! We'll be in touch shortly.
CustomFit.ai

The all-in-one website personalization, A/B testing & CRO platform for high-growth D2C brands. Made by marketers, fueled by coffee.

in๐•โ—Žโ–ถf
Product
  • Features
  • A/B Testing
  • Personalization
  • AI Copilot
  • AI Wingman
  • AI Conversion Optimizer
  • Feature Flags
  • Widgets
  • Integrations
  • ROI Calculator
Platforms
  • Shopify
  • Shopline
  • Shoplazza
  • Salesforce
  • Chrome Extension
  • All Integrations
Resources
  • Blog
  • Playbooks
  • Webinars
  • GrowthFit Interviews
  • Free E-Books
  • Conversion Glossary
  • Case Studies
Compare
  • vs VWO
  • vs Optimizely
  • vs Google Optimize
  • vs Mutiny
  • vs Intelligems
  • vs Shoplift
  • vs AB Tasty
  • vs Convert
  • vs Kameleoon
Company
  • About Us
  • Partners
  • CustomFit Awards
  • Recognition
  • Contact
  • Privacy Policy
  • Terms & Conditions
ยฉ 2026 CustomFit.ai ยท Valley Monks Pvt Ltd ยท Made by marketers, fueled by coffee, and obsessed with conversions.
SOC 2 Type II ยท GDPR ยท CCPA ยท ISO 27001

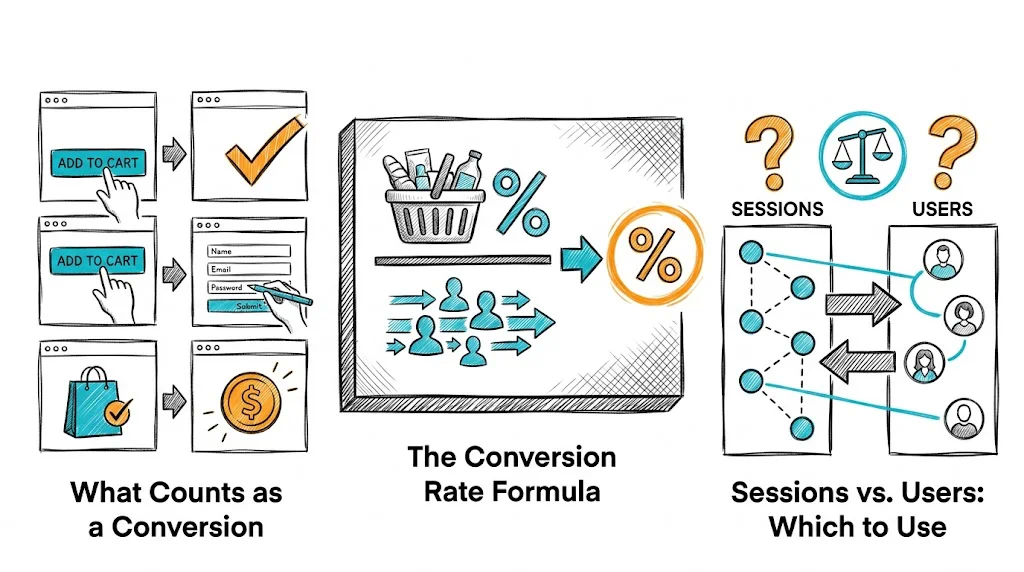
Conversion rate is the percentage of website visitors who complete a desired action โ€” for ecommerce, that's typically a purchase โ€” and it's the single most important metric for measuring how effectively your store turns traffic into revenue. The formula is straightforward: divide the number of conversions by total visitors and multiply by 100. But knowing the formula is only the start โ€” understanding what a good conversion rate looks like for your category, how to segment it meaningfully, and how to use it to diagnose growth opportunities is where the real value lies.

The Conversion Rate Formula

Basic formula:

Conversion Rate = (Conversions รท Total Visitors) ร— 100

Example:

  • 3,500 visitors in a month
  • 87 purchases
  • Conversion Rate = (87 รท 3,500) ร— 100 = 2.49%

This tells you that 2.49% of everyone who visited your store made a purchase.

What Counts as a "Conversion"?

The answer depends on what you define as your goal. For ecommerce:

Conversion TypeDefinitionUse Case
PurchaseCompleted transactionPrimary ecommerce metric
Add to CartItem added to cartIntermediate funnel metric
Checkout StartedCheckout page reachedDiagnosing checkout drop-off
Account RegistrationNew account createdFor subscription/loyalty programs
Email SignupLead capturedFor pre-launch or newsletter
Wishlist AdditionItem savedEngagement indicator

For most D2C brands, your primary conversion is a purchase. Track add-to-cart rate as a secondary metric to diagnose where in the funnel you're losing visitors.

Sessions vs. Users: Which to Use?

Sessions (visits): Each time someone visits your site counts as a session, even if the same person visits multiple times.

Users (unique visitors): Each person counts once regardless of how many times they visit.

For ecommerce, use sessions. Here's why:

  • Shopify's built-in reports use sessions
  • Google Analytics default uses sessions for conversion rate
  • It represents each purchase opportunity accurately
  • Multiple sessions by the same person before buying are valid opportunities you converted on the last visit

Exception: For subscription products where you want to track subscriber conversion rate, use unique users to avoid inflating the metric.

How to Find Your Conversion Rate in Shopify

In Shopify Analytics:

  1. Go to Analytics โ†’ Dashboard
  2. Look for "Online store conversion rate" in the key metrics section
  3. Set your date range (last 30 days is a good default)

Shopify shows conversion rate as a funnel: Added to Cart โ†’ Reached Checkout โ†’ Sessions Converted

This funnel view is more valuable than the top-line conversion rate โ€” it shows you exactly where visitors drop off.

Example funnel reading:

  • 10,000 sessions
  • 18% added to cart (1,800 sessions)
  • 12% reached checkout (1,200 sessions)
  • 2.5% converted (250 sessions)

If 1,800 added to cart but only 1,200 reached checkout, you're losing 600 potential buyers between cart and checkout. That's your highest-priority optimization opportunity.

Conversion Rate Benchmarks by Category

Benchmarks vary significantly by product category, price point, and traffic source. Use these as directional guidance:

CategoryLowAverageTop Performer
Beauty & Skincare1.5%3%6%+
Fashion & Apparel1%2.5%5%+
Health & Supplements2%3.5%7%+
Consumer Electronics1%2%4%+
Home & Kitchen1.5%2.5%5%+
Food & Beverages2%4%8%+
Subscription products3%5%10%+

Indian D2C benchmarks: Conversion rates for Indian D2C brands tend to be at the lower end of global benchmarks due to:

  • Higher proportion of first-time online shoppers
  • Greater proportion of COD orders (which have higher cancellation rates)
  • Mobile-first traffic that typically converts lower than desktop

CustomFit.ai's customers average an 11% lift in conversion rate after running their first 5 A/B tests โ€” brands like Bellavita hit 11% CVR improvement, Kapiva achieved 9.48%.

Segmenting Conversion Rate for Actionable Insights

A single blended conversion rate hides important information. Always segment:

By Traffic Source

SourceTypical CVR
Email marketing3โ€“8% (highest)
Direct/branded3โ€“6%
Organic search2โ€“4%
Paid social1โ€“3%
Paid search2โ€“5%
Referral1โ€“4%

Email subscribers are typically the highest-converting traffic because they've already opted in and trust your brand. If your email CVR is lower than organic search, your email targeting or content needs work.

By Device

DeviceTypical CVR
Desktop3โ€“5%
Tablet2โ€“4%
Mobile1โ€“3%

Mobile conversion rates are consistently lower than desktop โ€” but since 75โ€“85% of Indian D2C traffic is mobile, optimizing mobile conversion rate is the highest-priority work. A 1% absolute lift in mobile CVR (e.g., 2% โ†’ 3%) on mobile-dominant traffic has enormous revenue impact.

By New vs. Returning Visitors

Returning visitors typically convert at 2โ€“4x the rate of new visitors. If your returning visitor CVR is low, your retention experience needs work. If your new visitor CVR is very low, your first impression and trust signals need improvement.

By City/Region

Tier 1 cities (Mumbai, Delhi, Bangalore) typically show higher CVR than Tier 2/3 cities. But many D2C brands find that once they optimize for COD and vernacular content, Tier 2/3 CVR improves dramatically and becomes a significant revenue driver.

Why Conversion Rate Alone Can Mislead

Conversion rate is powerful but incomplete. Always view it alongside:

Average Order Value (AOV): A 5% CVR at โ‚น300 AOV generates less revenue than 3% CVR at โ‚น800 AOV. Optimizing purely for CVR can attract lower-quality buyers.

Revenue per Visitor (RPV): RPV = Conversion Rate ร— AOV. It captures both dimensions in a single metric and is the best single number for measuring the revenue impact of optimization work.

Bounce Rate: High bounce rate suppresses CVR by removing visitors before they can convert. Fixing bounce rate issues may lift CVR without any product page changes.

How to Use Conversion Rate to Find Growth Opportunities

Step 1: Establish your baseline

Calculate CVR for the past 30 days. Segment by device, source, and new vs. returning.

Step 2: Identify the biggest gaps

Compare your segments. If mobile CVR is 1.2% vs. desktop 4.1%, mobile optimization is your biggest opportunity.

Step 3: Find the funnel drop-off point

Use Shopify's conversion funnel (sessions โ†’ add to cart โ†’ checkout โ†’ purchase) to identify where visitors are leaving.

Step 4: Form a hypothesis

"Mobile visitors are converting at 1.2% because our mobile product page requires scrolling past the fold to see the CTA button. Moving the CTA above the fold will increase mobile CVR by at least 0.3%."

Step 5: Run an A/B test

Use CustomFit.ai to create a variant and test your hypothesis. Track CVR and RPV for the variant vs. control.

Step 6: Iterate

The best ecommerce brands run 2โ€“4 tests per month and compound CVR improvements over time. A 5% CVR improvement from 3 tests = compounding growth.

Conversion Rate and A/B Testing

Every A/B test is fundamentally a conversion rate experiment. When you test:

  • A product page headline โ†’ you're testing whether the new copy increases CVR
  • A CTA button color โ†’ you're testing whether the visual change increases CVR
  • A checkout form layout โ†’ you're testing whether reduced friction increases CVR

Use CVR as your primary metric for most tests, alongside RPV to capture the full revenue impact.

Related Articles

  • Good Conversion Rate by Industry: 2026 Benchmarks โ€” Detailed benchmarks
  • Ecommerce Conversion Rate Benchmarks 2026 โ€” Industry-wide data
  • CRO Process: Step-by-Step Framework โ€” How to systematically improve CVR
  • Best A/B Testing Tools for Ecommerce โ€” Tools to run conversion rate tests
  • Conversion rate glossary definition

Key Takeaways

  • Conversion Rate = (Conversions รท Visitors) ร— 100 โ€” use sessions, not users, for standard ecommerce reporting
  • For Indian D2C brands, 1โ€“3% is typical, 3โ€“5% is good, 5%+ is excellent โ€” benchmarks vary by category
  • Always segment CVR by device, traffic source, and new vs. returning โ€” blended CVR hides actionable insights
  • Mobile CVR is typically 2โ€“3x lower than desktop โ€” with 75โ€“85% of Indian D2C traffic on mobile, this is your biggest opportunity
  • Track RPV (Revenue per Visitor) alongside CVR โ€” optimizing CVR alone can lower AOV and hurt overall revenue
  • Use CVR data to identify funnel drop-off points and form hypotheses to test with A/B testing