From the conversion glossary
Concepts referenced in this article, defined.
Concepts referenced in this article, defined.
Run rigorous A/B tests and personalize every visit on Shopify or any storefront — no engineers required.
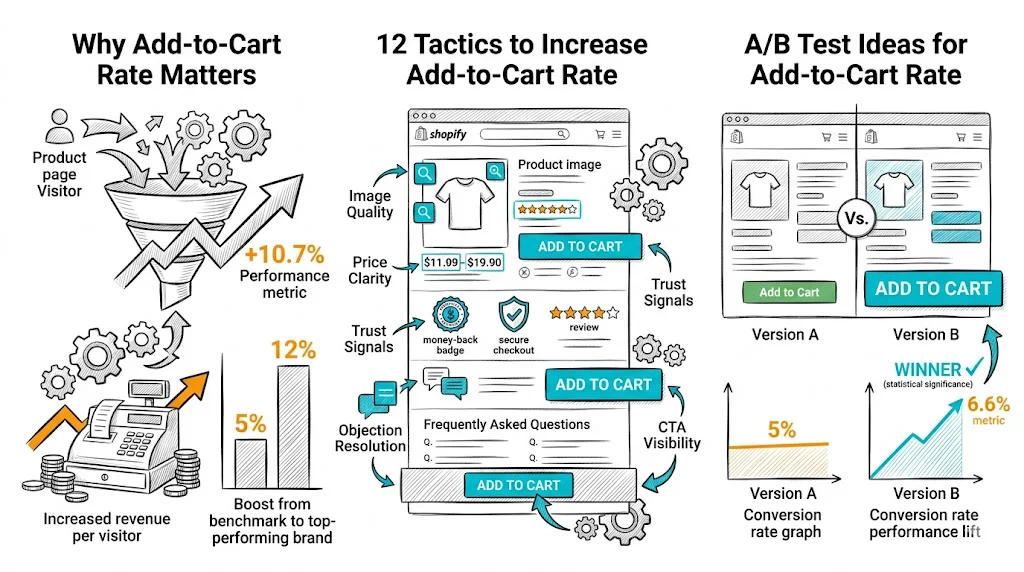
Add-to-cart rate is the most actionable product page metric for D2C ecommerce — it directly measures how well your product page creates purchase intent, and improving it lifts revenue without requiring more traffic or a lower price. The industry benchmark for ecommerce is 5–10%, but top-performing D2C brands on Shopify achieve 12–18% by systematically testing the elements that drive the click: CTA visibility, image quality, price clarity, trust signals, and objection resolution. This guide gives you 12 proven tactics to test immediately.
Add-to-cart rate sits at the most valuable moment in your conversion funnel — the moment a visitor decides "I want this." Once they add to cart, they're expressing intent to buy. Your job is then to not lose them at checkout.
The funnel math:
If you improve add-to-cart from 8% to 10% (25% relative improvement):
This single change is consistently the highest-ROI tactic for Indian D2C brands with mobile-heavy traffic. If your "Add to Cart" button requires scrolling past the product image and description on mobile, you're losing buyers before they act.
How to fix:
Expected impact: 10–20% mobile ATC rate improvement Time to implement with CustomFit.ai: Under 30 minutes, no developer needed
"Add to Cart" is the standard, but it's worth testing alternatives:
See our A/B testing CTA buttons guide for the complete copy testing framework.
Product images are the single biggest driver of add-to-cart rate. Visitors can't touch or try your product — the image has to do that work.
What to test:
For Indian D2C brands: South Asian models using the product consistently outperform stock images or international imagery. Nykaa, Sugar, and Mamaearth all use market-specific imagery.
Ambiguous or hidden discounts suppress add-to-cart rate. Visitors who aren't sure they're getting a good deal don't click.
Best practices for price display:
Quick A/B test: Control = "₹599" alone. Variant = "₹799 ₹599 — Save ₹200".
Feature-heavy descriptions tell customers what's in the product. Benefit-heavy descriptions tell them what will change for them.
| Feature-led | Benefit-led |
|---|---|
| "Contains 2% Retinol" | "Visibly reduces fine lines in 4 weeks" |
| "200ml bottle" | "Lasts 3 months with daily use" |
| "Made with Ashwagandha" | "Reduces stress-related cortisol levels by 28%" |
Rewriting your top 5 product descriptions to lead with the primary customer benefit typically lifts ATC by 5–12%.
Showing "4.7/5 (2,340 reviews)" directly above or below the CTA button — not buried in a review section at the bottom — increases purchase confidence at the decision point.
What to include:
Real scarcity and urgency increase ATC by creating action motivation:
Never use false urgency — "Only 2 left!" when you have 500 in stock. Indian consumers are sophisticated and fake urgency damages trust and repeat purchase rates.
If your product has multiple variants (size, color, flavor, strength), confusing variant selectors suppress ATC:
Upgrade from dropdowns to visual selectors:
Add a size guide link directly on the page — a "Find My Size" link near the size selector reduces the friction of guessing and the fear of ordering wrong.
For Indian D2C brands, two add-to-cart killers are: uncertainty about delivery timing and uncertainty about payment options.
Fix both:
Showing COD availability on the product page (not just at checkout) can lift ATC for Tier 2/3 traffic by 8–15%.
Every product has 3–5 common objections that prevent add-to-cart. Find them from customer support tickets, reviews, and on-site polls. Then answer them proactively on the page.
Common objections by category:
Showing complementary products below the main product CTA doesn't just increase AOV — it also increases ATC by helping visitors who are browsing to "complete the look" or "complete the routine" and add multiple items.
Segmentation allows you to show different product page experiences to different visitor types:
CustomFit.ai's 1,000+ targeting attributes make all of this possible without developer involvement.
| Priority | Test | Variant vs. Control | Expected Lift |
|---|---|---|---|
| 1 | Mobile sticky CTA | Floating bar vs. static | 10–20% |
| 2 | CTA copy | "Buy Now" vs. "Add to Cart" | 5–15% |
| 3 | First product image | Lifestyle vs. white bg | 8–20% |
| 4 | Price display | With savings shown vs. price only | 5–10% |
| 5 | Reviews near CTA | Above CTA vs. below fold | 5–10% |
| 6 | COD badge | Visible near CTA vs. not shown | 8–15% (Tier 2) |
Find your add-to-cart rate in Shopify Analytics:
You'll often find desktop ATC is 2–3x mobile ATC — confirming where to focus first.