From the conversion glossary
Concepts referenced in this article, defined.
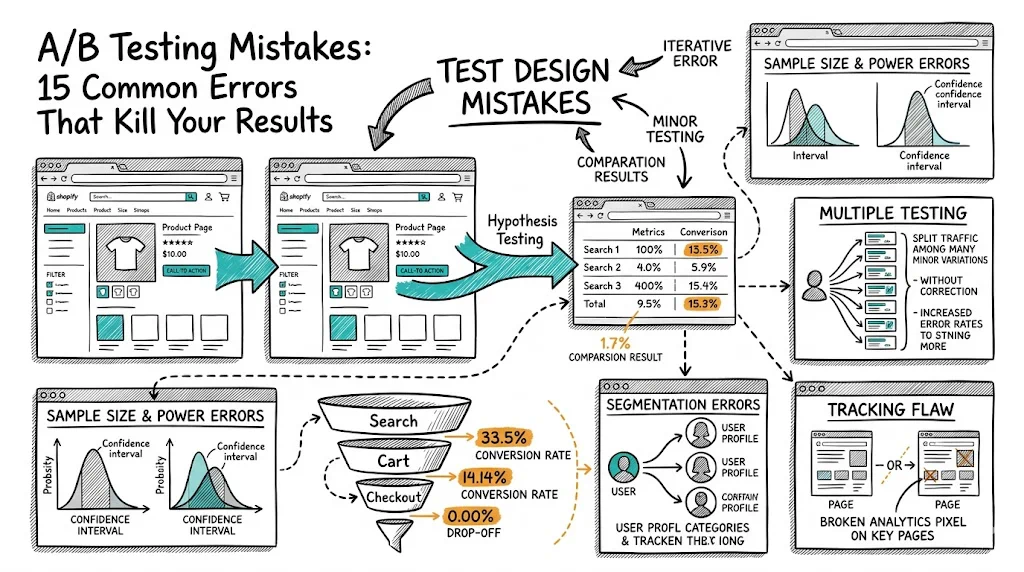
The 15 most common A/B testing mistakes: stopping tests early, insufficient sample size, testing without a hypothesis, ignoring mobile, and more. Learn how to avoid them.
Concepts referenced in this article, defined.
Run rigorous A/B tests and personalize every visit on Shopify or any storefront — no engineers required.
Most D2C brands that say "A/B testing doesn't work for us" have made at least five of the mistakes on this list. They ran tests that looked successful — variant winning, numbers moving — and shipped the changes, only to see no real improvement or even a decline. The problem wasn't testing. The problem was how they tested.
A/B testing done correctly is one of the highest-ROI activities in ecommerce. Done incorrectly, it's worse than not testing at all, because you build false confidence in bad decisions. These 15 mistakes are the most common reasons test results mislead teams — and each one is entirely avoidable.
These are the most damaging mistakes because they corrupt the validity of results you may act on for months.
This is the single most costly A/B testing mistake. A test looks like the variant is winning at 91% significance on day 5 — so you stop it and ship the variant. The problem: you haven't reached statistical significance, and the early lead is almost certainly noise.
Early in a test, small sample sizes amplify randomness. A run of 20 sequential purchasers who all happened to be assigned to the variant can make conversion rates swing wildly. With 500 visitors, a 3-percentage-point difference could easily flip the other direction by visitor 1,000.
How to avoid it: Set your sample size requirement before launching, using a sample size calculator. Do not touch the test until that threshold is met and your minimum duration has elapsed. Treat the running results as off-limits for decisions.
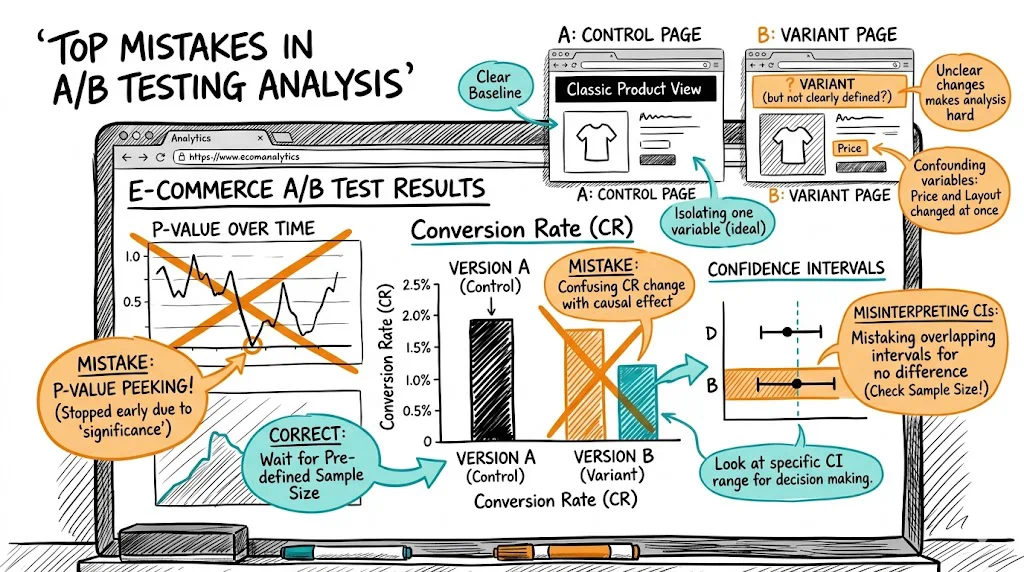
Many teams run tests to 80% or 85% significance because it's faster. At 80% significance, there's a 1-in-5 chance your result is random noise. Ship 10 "winners" tested at that threshold and two of them will be losers.
The industry standard is 95% statistical significance (p < 0.05) for a reason. It's not a bureaucratic formality — it's the threshold at which false positives become rare enough that the cost of wrong decisions is outweighed by the value of right ones.
How to avoid it: Set 95% as your minimum, non-negotiable significance threshold. If your test never reaches it, the result is inconclusive — which is valid information.
Launching a test without a sample size calculation is like starting a road trip without knowing how far you're driving. You'll either stop too early (before you have enough data) or run the test far longer than necessary.
Sample size depends on three inputs you need to decide in advance: your current conversion rate (baseline), the minimum relative lift you care about detecting (commonly 10–15%), and your significance and power thresholds (95% and 80% respectively). Plug these into any sample size calculator and you get the minimum visitors per variant needed before results are valid.
How to avoid it: Run the calculation before you create the test. Write the required sample size in your test plan. Use it as a hard gate before analysis.
You launch a test and check the dashboard every morning. On day 8, significance hits 96% — variant is winning. You call it and ship.
What you've done is committed a statistical error called sequential testing without correction. When you check results repeatedly and stop at the first significant result, you dramatically inflate your false positive rate. Checking daily for 20 days at a nominal 95% threshold gives you roughly a 30% real chance of a false positive by the end.
This isn't intuitive, which is why so many teams do it. The fix requires discipline more than skill.
How to avoid it: Check results only at pre-planned intervals (end of week, or at your required sample size). Never make a decision based on interim significance. If you need to monitor for serious problems (a bug causing zero conversions on the variant), build an automated alert — don't manually peek and interpret.
Even if your variant hits statistical significance in 6 days, running a test for less than 14 days produces unreliable results. Why? Weekly traffic cycles.
Visitors on Monday behave differently from visitors on Saturday. Weekday shoppers often have higher intent and faster purchase decisions; weekend browsers are more exploratory. A test that captures only weekday traffic produces a biased sample that doesn't represent your full customer base.
How to avoid it: Set a minimum test duration of 14 days, regardless of when you reach your sample size. For brands with strong seasonal or day-of-week patterns, 21–30 days is safer.
Statistical validity only matters if the test itself is designed correctly. These mistakes undermine results before data collection even begins.
A hypothesis isn't a formality — it's the mechanism that makes testing a learning system rather than a guessing machine. "Let's test a red button" is not a hypothesis. "We believe changing the CTA button color from grey to saffron will increase click rate because eye-tracking data shows users aren't fixating on the current button" is.
Without a hypothesis, when the test ends you have a result but no insight. You don't know why it won or lost. You can't build on it. Your next test is as uninformed as the last.
How to avoid it: Write a full hypothesis before every test: "We believe [change] will [improve metric] because [evidence]." The "because" is mandatory. No evidence, no test.
Your variant has a new headline, a new hero image, a reordered benefits section, and a different button color. The variant wins. Which change drove it?
You don't know. You can't know. And you've just lost the learning from four separate hypotheses that could have powered four separate future tests. Worse, if three of the changes helped and one hurt, you've permanently shipped the one that hurt.
How to avoid it: One change per test, one element per variant. The only exception is a complete page redesign tested against the original — but in that case, accept that you're measuring the whole, not the parts, and plan follow-up tests to isolate components.
Every test needs exactly one primary success metric, defined before launch. If you evaluate your test on whichever metric happens to look best after the fact, you're p-hacking — hunting through your data for a significant result.
Teams often end up with "winner" tests that increased add-to-cart but had no effect on purchases, or increased page time but decreased conversions. The metric that matters is the one closest to revenue.
How to avoid it: Define the primary metric in your test plan before launch. Secondary metrics can be monitored, but they're informational only. The primary metric determines whether the variant wins or loses, full stop.
Your 404 page, your about page, your careers page — none of these are useful A/B test targets for most D2C brands, because they don't have enough traffic to reach significance in any reasonable timeframe. Testing a page that gets 200 visitors per month would take years to reach a valid sample size for a 10% lift.
Testing low-traffic pages isn't just slow — it wastes the optimization time and attention that could go to your product pages, homepage, and checkout, which get 10x the traffic.
How to avoid it: Before creating a test, estimate time-to-significance using your traffic and a sample size calculator. If it'll take more than 60 days to reach significance, the page isn't ready for A/B testing. Prioritize your highest-traffic pages first.
A test is running and someone on the team notices a bug in the variant, or a stakeholder wants to tweak the copy. They make the change while the test is live.
This invalidates the test. Visitors who saw the old variant version and visitors who see the new version are now mixed together in the same data bucket. The before/after change point creates a confound that makes your results uninterpretable.
How to avoid it: Treat a live test as frozen. If there's a genuine bug that's broken the variant, pause or stop the test — don't patch it mid-run. If it's a stakeholder wanting to iterate, document the suggestion for the next test and hold the line.
Even correctly designed and run tests can be misread at analysis time. These mistakes happen after the data is in.
A variant that lifts desktop conversion by 8% and depresses mobile conversion by 6% will look like a marginal overall winner — maybe 2% aggregate lift — if you analyze only the aggregate. Ship it and you've just degraded the experience for your majority-mobile Indian D2C audience.
Aggregate results mask segment-level effects. For most D2C brands in India, 70–80% of traffic is mobile. A test result that harms mobile is a harmful test result, regardless of what the aggregate says.
How to avoid it: Always segment test results by device (mobile/desktop/tablet) before declaring a winner. If the variant performs differently across devices, treat that as a finding — not noise — and consider device-specific experiences.
Paid traffic, organic traffic, and direct traffic often have different intent levels and brand familiarity. A variant that works for organic visitors (who found you through search and are in research mode) may not work for retargeting traffic (who already know the brand and need a nudge, not education).
Showing aggregate results without traffic source segmentation can hide both opportunities and risks.
How to avoid it: After calling a winner, cut the results by traffic source: paid social, paid search, organic, direct, email. If a variant wins strongly for one source and loses for another, that's more valuable than the aggregate — it tells you where to deploy the change and where to keep the control.
The test shows no significant difference in the primary metric (add-to-cart rate), but the variant has significantly higher time on page and lower bounce rate. The team declares it a winner based on engagement.
Engagement metrics are not conversion metrics. Time on page going up can mean users are more interested — or that your page is harder to navigate and taking longer to parse. Always judge tests on the metric that matters: the one closest to revenue.
How to avoid it: The primary metric determines the outcome. If the primary metric is not significantly better, the test is inconclusive or the control wins. Secondary metrics provide hypotheses for future tests, not justifications for the current one.
A test ran, the variant won, the team shipped it. Six months later, someone wants to test something on the same page and has no idea what was already tested, what the hypothesis was, or why the current version looks the way it does. The same tests get repeated. The same mistakes get made.
Undocumented testing programs can't compound. Every undocumented test is a lost learning.
How to avoid it: Maintain a test log with: test name, page, hypothesis, primary metric, sample size, duration, result (lift and significance), and key learning. Make this log searchable and visible to the whole team. CustomFit.ai keeps this record automatically, tied to each experiment.
This is the meta-mistake underlying several others. An online store with 3,000 monthly visitors is not ready for A/B testing on most pages. At that traffic level, reaching a valid sample size for a 15% lift with 95% significance takes months — during which time your site, your offers, and your market may all have changed.
Brands with low traffic need a different approach: qualitative research (interviews, surveys, session recordings), usability testing, and expert CRO audits. These methods generate hypotheses and improvements without requiring statistical significance. Only once monthly unique visitors cross roughly 10,000–15,000 does standard A/B testing become a practical tool for most pages.
How to avoid it: Be honest about your traffic level. If you're below the threshold, invest in qualitative research and direct customer feedback. Use that learning to make informed changes without A/B testing, and build your traffic so that A/B testing becomes viable.
Use this table before and after every test to catch mistakes before they cost you.
| Mistake | How to Avoid |
|---|---|
| Stopping too early | Pre-calculate sample size; don't touch test until met |
| Low significance threshold | 95% minimum, always |
| No sample size calculation | Run calculator before creating the test |
| Peeking problem | Check results only at planned intervals |
| Under 14 days | Minimum 14 days, regardless of significance |
| No hypothesis | Write "We believe... will... because..." before every test |
| Multiple changes | One change, one element per variant |
| Multiple primary metrics | Define one primary metric before launch |
| Testing low-traffic pages | Estimate time-to-significance; skip if > 60 days |
| Mid-test changes | Freeze the test; document suggestions for next test |
| No mobile/desktop split | Always segment by device before declaring winner |
| No traffic source split | Segment by source after calling winner |
| Winning on secondary metrics | Primary metric rules; secondary metrics are hypotheses only |
| No documentation | Log every test: hypothesis, result, learning |
| Insufficient site traffic | Below 10K-15K monthly visitors? Use qualitative methods first |
Running cleaner tests starts with avoiding these 15 mistakes. For deeper context on the statistical concepts — p-values, significance thresholds, and sample size — see our guide to A/B testing statistical significance. And if you're starting from the beginning, what A/B testing is is the right place to begin before building your A/B testing program.
1,000+ D2C brands use CustomFit.ai to run A/B tests — without code, without developer tickets. 14-day free trial · No credit card required.