
From the conversion glossary
Concepts referenced in this article, defined.
Calculate how many visitors you need for a valid A/B test. Inputs: baseline CVR, minimum detectable effect, confidence level. Includes formula and worked examples.
Concepts referenced in this article, defined.
Run rigorous A/B tests and personalize every visit on Shopify or any storefront — no engineers required.
You need roughly 4,500 to 8,000 visitors per variant to run a valid A/B test on a typical ecommerce product page — but the exact number depends on three things: your current conversion rate, how large an improvement you want to be able to detect, and the confidence threshold you're working to.
Here's the quick version: the lower your baseline conversion rate and the smaller the improvement you're testing for, the more traffic you need. A 1% CVR page needs roughly twice the traffic of a 2% CVR page to detect the same relative lift.
If you want to understand why — and how to calculate your specific number — read on.
Use this table as your starting point. These figures assume 95% statistical confidence, a 10% minimum detectable effect (relative), and a 50/50 traffic split between control and variant.
| Baseline CVR | MDE (10% relative lift) | Absolute lift you're detecting | Visitors per variant | Total visitors | Days at 500/day |
|---|---|---|---|---|---|
| 1% | +10% relative | 1.0% → 1.1% | ~16,000 | ~32,000 | 64 days |
| 2% | +10% relative | 2.0% → 2.2% | ~8,000 | ~16,000 | 32 days |
| 3% | +10% relative | 3.0% → 3.3% | ~5,500 | ~11,000 | 22 days |
| 5% | +10% relative | 5.0% → 5.5% | ~3,200 | ~6,400 | 13 days |
| 8% | +10% relative | 8.0% → 8.8% | ~2,000 | ~4,000 | 8 days |
| 10% | +10% relative | 10.0% → 11.0% | ~1,600 | ~3,200 | 7 days |
Key takeaway: If your product page converts at 2% and you want to detect a 10% relative improvement (i.e., taking CVR from 2.0% to 2.2%), you need 8,000 visitors per variant — 16,000 total. At 500 daily page visitors, that's 32 days.
If you can only tolerate a 30-day test, and you get 500 visitors per day to the page, you can reliably detect a 10% lift on anything above a 2% baseline.
Before you use any sample size calculator, you need four numbers. Here's where to get each of them.
This is your current CVR on the page you're testing. Pull it from your analytics platform (Google Analytics 4, Shopify Analytics, or your attribution tool) over the last 30–90 days.
Important: Use the conversion rate for the specific goal you're testing, on the specific page you're testing. If you're testing a product page, use "add to cart" or "purchase" rate from that page — not sitewide CVR.
Practical note for Indian D2C brands: Conversion rates vary significantly by traffic source. Organic search visitors typically convert at 2–4%. Paid traffic (Meta, Google) tends to be 1–2.5%. Brand traffic can be 5–8%. If your test page receives a mix of sources, use the blended CVR but be aware that seasonal spikes (Big Billion Days, Diwali, Republic Day sales) will distort your baseline if they fall during the test period.
MDE is the smallest improvement you want the test to be able to detect reliably. This is a business decision, not a statistics decision.
Ask yourself: what's the minimum CVR improvement that would justify implementing this change?
For most D2C tests, 10% relative lift is a practical MDE. It's the threshold at which most implementations are clearly justified, and it's achievable on most reasonable page elements.
Avoid setting your MDE below 5% relative unless you have very high traffic. Chasing 2–3% relative lifts requires enormous sample sizes and typically provides marginal business value.
Use 95% (p < 0.05) as your default. This means there's a 5% chance of a false positive — declaring a winner when none exists.
If you're testing something expensive to reverse (a full checkout flow redesign, a new pricing model), use 99% confidence. This roughly doubles your required sample size.
Never drop below 95%. The 90% threshold sounds reasonable but doubles your false positive rate compared to 95%, which corrupts your testing programme over time.
Use 50/50 (equal traffic to control and variant) unless you have a specific reason not to. Equal splits are the most statistically efficient — any deviation increases the total sample size you need.
Some teams use 90/10 or 80/20 splits when testing risky changes (protecting most traffic from a potentially worse experience). That's a valid risk management approach, but you'll need 5–9x more total traffic to reach significance. Only use unequal splits for genuinely high-risk changes.
The full statistical formula involves standard deviations and z-scores. Here's the simplified version for conversion rate tests:
n = (Z² × 2p(1-p)) / d²
Where:
Worked example:
n = (1.96² × 2 × 0.03 × 0.97) / 0.003² n = (3.84 × 0.0582) / 0.000009 n = 0.2235 / 0.000009 n ≈ 24,833
Wait — that's much higher than the 5,500 in the table above. Why?
Because this formula uses 80% statistical power (the ability to detect a real effect) as an additional parameter, and I simplified it above. The full formula that accounts for both 95% confidence AND 80% power is:
n = 16 × p(1-p) / d²
(The constant 16 encodes both the z-scores for confidence and power.)
n = 16 × 0.03 × 0.97 / (0.003)² n = 16 × 0.0291 / 0.000009 n = 0.4656 / 0.000009 n ≈ 5,173 per variant
That matches the reference table. The key shortcut: n ≈ 16 × p(1-p) / d² — where d is the absolute CVR difference you want to detect.
You don't need to do this manually for every test. Use a pre-built calculator, or let your testing tool calculate it automatically. But understanding the formula helps you understand why traffic, MDE, and baseline CVR are so tightly connected.
Let's walk through a complete sample size calculation for a realistic D2C scenario.
Brand: A Bangalore-based D2C supplements brand Product: Whey protein, ₹2,199 per 1kg Test: Changing the product headline from "Whey Protein — 24g per serve" to "Recover Faster. Build Stronger. 24g Whey Protein." Goal metric: Add-to-cart rate on the product page
Step 1: Pull baseline data From Shopify Analytics over the last 60 days:
Step 2: Set MDE The team decides: if the new headline generates less than a 10% relative lift (i.e., from 3.0% to 3.3%), it's not worth implementing given the complexity of updating it across multiple product pages. MDE = 10% relative = 0.3% absolute
Step 3: Calculate sample size n = 16 × 0.03 × 0.97 / (0.003)² n ≈ 5,173 visitors per variant Total: ~10,350 visitors
Step 4: Calculate test duration At 200 daily page visitors with a 50/50 split: 10,350 total visitors / 200 per day = 52 days
Step 5: Decision 52 days is within range for a high-AOV product where a 10% lift represents meaningful revenue. At ₹2,199 AOV and a current 200 visits/day:
For a one-time headline change, a 52-day test is worth running.
Alternative: If 52 days feels too long, increase MDE to 20% (testing bolder variants) — this reduces required sample size to ~1,300 per variant (13 days). But now you're only declaring a winner if the lift is 20%+, which may not happen with a minor copy tweak.
Low traffic is the reality for most early-stage Indian D2C brands. Here's how to run meaningful experiments anyway.
Your product page might get 150 visitors per day. Your homepage might get 1,200. Your collection page might get 800.
Test on higher-traffic pages first. Homepage hero headline tests, announcement bar tests, and collection page layout tests all run faster and build your testing muscle. Move to product page tests once you have the traffic — or once you've grown the brand enough.
If you only have traffic for a 20-day test and your calculator tells you that requires a 20% minimum detectable effect — test a change that has a real shot at delivering 20%.
Bold changes: completely different value propositions, social proof vs. no social proof, lifestyle photography vs. product shots, short-form vs. long-form page.
Incremental changes (button colour tweaks, minor copy edits) are for brands with scale. Early-stage brands should be testing hypotheses, not optimising decimals.
Some tests are worth 60-90 day runtimes. Calculate the annual revenue impact of the lift you're trying to detect. If a 10% CVR lift on a ₹5,000 AOV product generating 50 orders per month = ₹3 lakh/year incremental revenue, a 90-day test is a reasonable investment.
The rule: longer test duration is fine if you commit to it upfront and don't peek. The problem isn't long tests — it's stopping early because you saw a promising result on day 12.
Frequentist testing at 95% confidence requires substantial sample sizes. Bayesian A/B testing provides probabilistic guidance even with smaller samples — "72% probability Variant B is better than Control."
This doesn't mean you're making decisions with 72% confidence in the same sense as frequentist 95%. But for low-traffic brands making reversible decisions, it provides a structured framework better than pure guesswork.
These mistakes are common, costly, and largely avoidable.
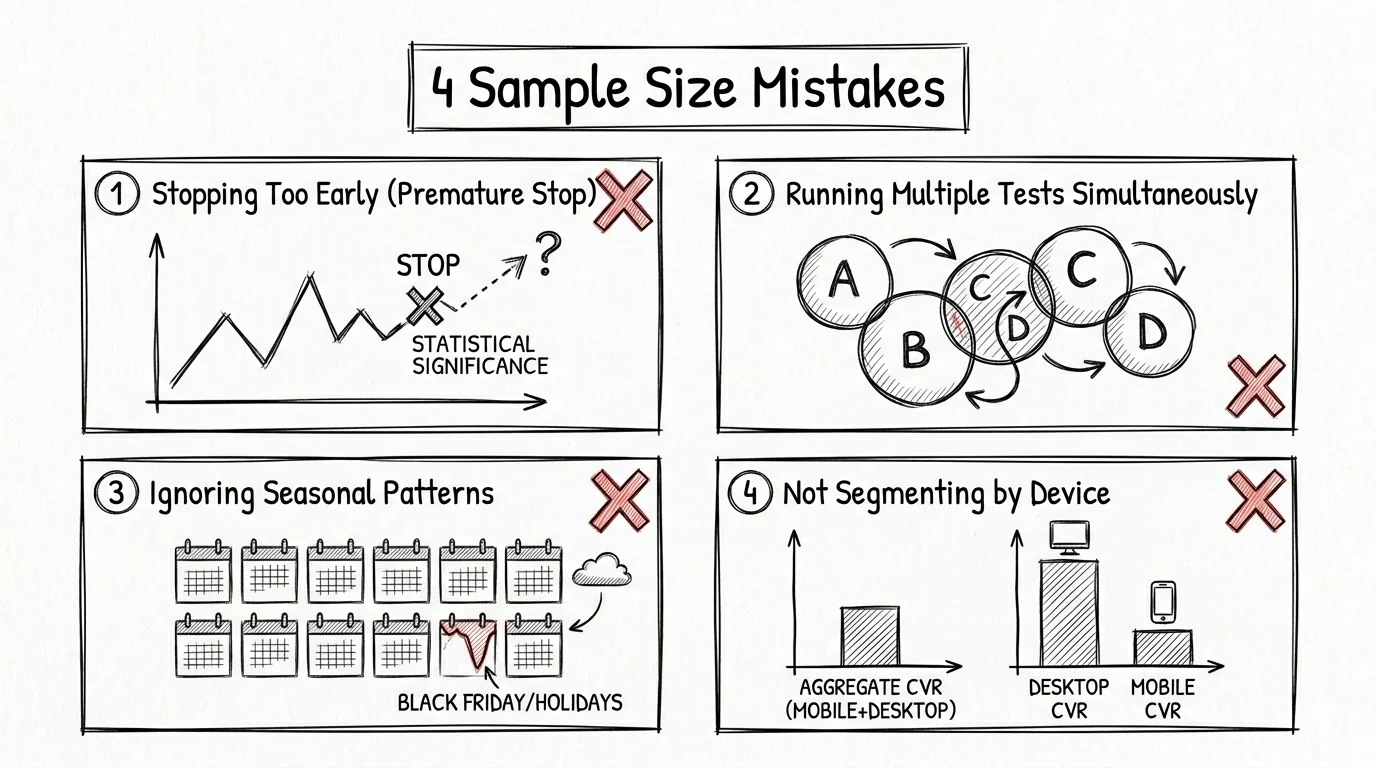
If you don't calculate required sample size before launching a test, you have no principled basis for deciding when to stop. You'll stop when it "feels right" — which usually means stopping when you see a result you like.
This is the most common testing mistake and the source of most false positives in D2C testing programmes. Always calculate before you start. Always.
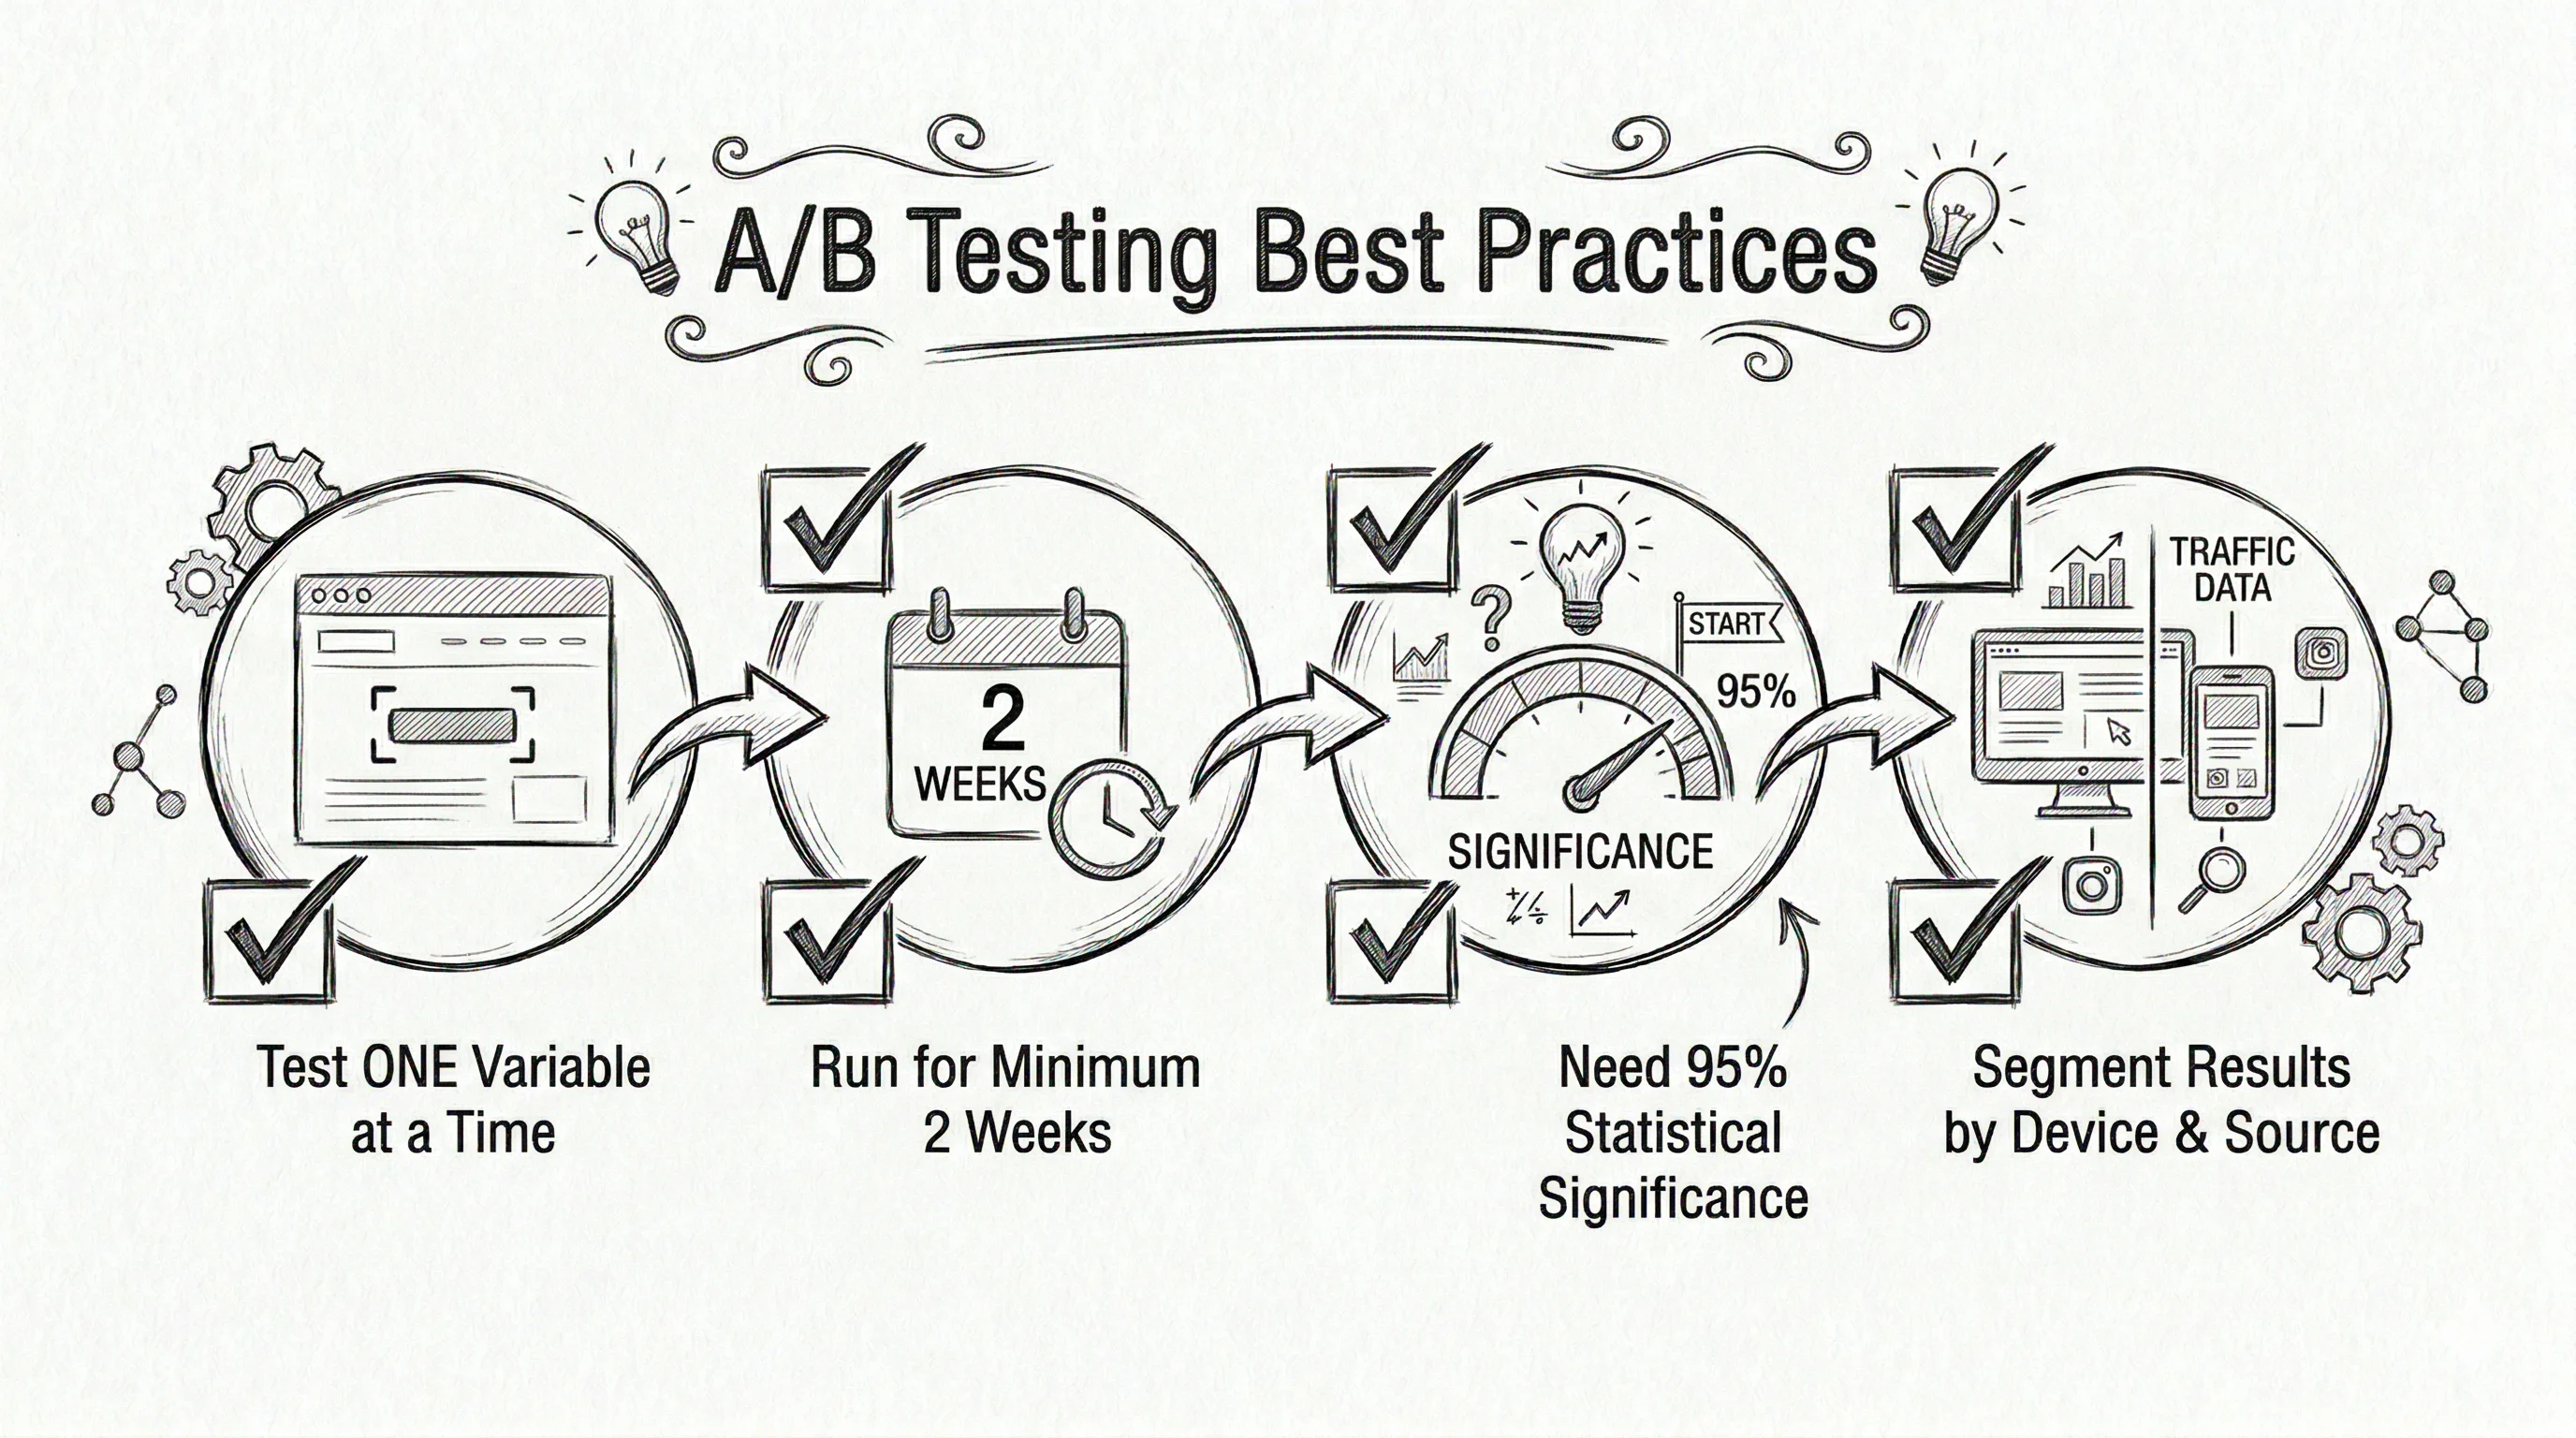
Even if your calculator says you need only 7 days of data to hit the required sample size, always run for a minimum of 14 days.
Why? Consumer behaviour is not uniform across the week. Your conversion rate on a Saturday evening is different from a Tuesday morning. Buyers coming from paid ads on weekends behave differently from organic search visitors during the week. If you stop at 7 days, your sample may systematically over- or under-represent certain behavioural patterns.
The 14-day minimum captures two full weekly cycles, ensuring your results represent the true range of your audience's behaviour.
If you're testing three variants (Control + Variant A + Variant B), you need the required sample size for each variant — not split between them.
That means:
This is why running too many variants simultaneously is problematic for low-traffic stores. Stick to A/B (two variants) unless you have the traffic to support more.
Also: when you run three variants, you're doing three comparisons (A vs B, A vs C, B vs C). This increases the risk of a false positive. Apply a Bonferroni correction: use p < 0.017 instead of p < 0.05 for each comparison to maintain a 5% overall false positive rate.
Don't start a test during Diwali, Republic Day sale, a major paid campaign launch, or right after an influencer post goes viral. Your traffic composition during those periods is atypical and won't reflect your steady-state audience.
Run tests during "normal" traffic weeks. If you must run during a sale, keep the test running for at least 7 days after the sale period ends so steady-state behaviour re-enters the data.
Calculating sample sizes manually, monitoring significance without peeking, and knowing when to stop a test are all solvable problems — but they require discipline and statistical literacy that many D2C growth teams simply don't have bandwidth for.
CustomFit.ai handles all of this in the platform:
The result: your team focuses on test ideas and business decisions — not on spreadsheets and significance calculators.
For the full context on significance and what these numbers mean, read our guide on statistical significance in A/B testing. To understand the full testing framework from hypothesis to decision, start with what is A/B testing or the A/B testing pillar guide.
1,000+ D2C brands use CustomFit.ai to run statistically valid A/B tests without needing a data science team. 14-day free trial · No credit card required · Setup in under 30 minutes.