D2C unit economics are the per-customer financial metrics that determine whether your brand is actually building value or just burning cash on growth. The three most important numbers are Customer Acquisition Cost (CAC), Lifetime Value (LTV), and the ratio between them—get these right and every other business decision becomes clearer. Indian D2C brands that understand these metrics grow more efficiently than those chasing top-line revenue at any cost.
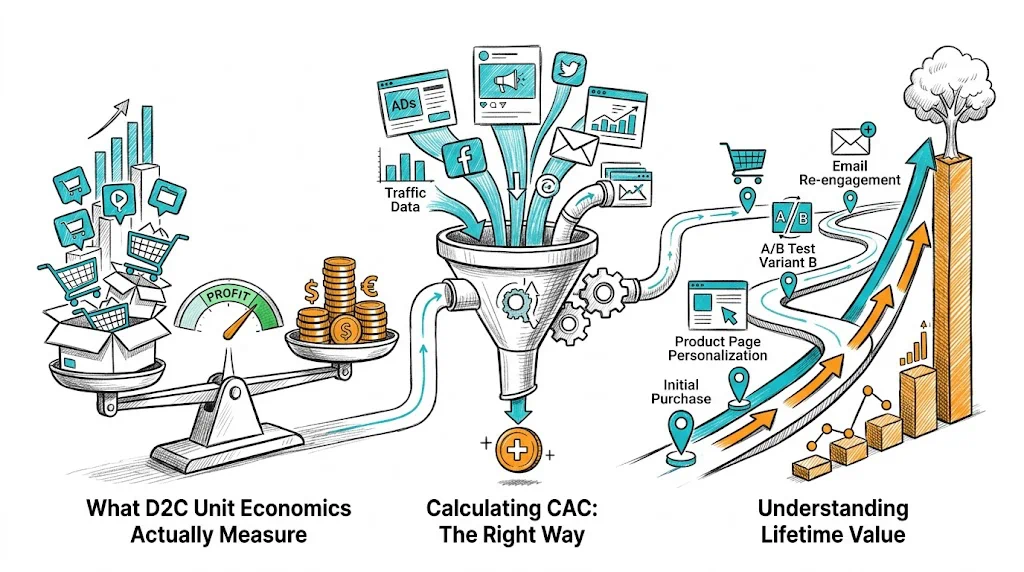
What D2C Unit Economics Actually Measure
Unit economics answer one fundamental question: do you make money on each customer you acquire?
A brand with ₹10 crore in revenue can be deeply unprofitable if CAC is too high or LTV too low. A brand with ₹1 crore in revenue can be highly efficient if the numbers work. Revenue tells you nothing about health; unit economics tell you everything.
The core metrics:
- CAC (Customer Acquisition Cost): What you spend to acquire one new customer
- LTV (Lifetime Value): Total revenue (or gross profit) a customer generates over their relationship with your brand
- LTV:CAC Ratio: The multiplier that tells you whether acquisition is efficient
- Payback Period: How many months until a customer's gross profit covers their CAC
- Contribution Margin: Revenue minus variable costs, before fixed costs
For D2C brands in India, these metrics have a specific flavor: COD returns (which are higher than prepaid), UPI adoption by segment, and festive season spikes all affect the numbers in ways that generic benchmarks from US D2C brands don't account for.
Calculating CAC: The Right Way
Most founders calculate CAC wrong—then make expensive decisions based on the wrong number.
The basic formula:
CAC = Total Sales & Marketing Spend / Number of New Customers Acquired
For a brand that spent ₹5,00,000 on ads and acquired 500 new customers: CAC = ₹1,000.
What to include in "total spend":
- Ad spend (Meta, Google, YouTube)
- Influencer and creator fees
- Agency or freelancer fees
- Discounts and offers for new customers (these are acquisition costs)
- Referral program costs
What founders often miss:
- Attribution matters. A customer who clicked a Meta ad, then came back via organic search, then converted—is attributed differently depending on your model. Use a consistent attribution window (typically 7-day click, 1-day view for Meta).
- Blended CAC vs. channel CAC: Your blended CAC (across all channels) might be ₹800, but your Meta CAC might be ₹1,400 and your organic CAC ₹200. Scaling the wrong channel can destroy unit economics even while blended CAC looks fine.
Improving CAC:
The fastest lever is improving your store's conversion rate. If you spend ₹5,00,000 to drive 10,000 visitors and convert at 5% (500 customers), your traffic CAC is ₹1,000. Improve CVR to 8% (800 customers) and traffic CAC drops to ₹625—same spend, 37% better CAC.
This is exactly why brands like Bellavita invest in A/B testing and personalization. Their 11% CVR improvement directly reduced CAC by making the same ad spend work harder.
Understanding Lifetime Value
LTV is what you earn from a customer over their entire relationship with your brand. Getting this right requires knowing two things: how much customers spend per order, and how many times they order.
The formula:
LTV = Average Order Value × Purchase Frequency × Average Customer Lifespan
For a skincare brand:
- AOV = ₹950
- Purchase frequency = 3.2 orders/year
- Average customer lifespan = 1.8 years
- LTV = ₹950 × 3.2 × 1.8 = ₹5,472
But this is revenue LTV. What you actually care about is gross profit LTV:
Gross Profit LTV = LTV × Gross Margin %
If gross margin is 55%: Gross Profit LTV = ₹5,472 × 0.55 = ₹3,010
This is the number that must exceed CAC by a healthy margin (the 3:1 rule).
Improving LTV:
- Increase AOV: Bundles, cross-sells, and free shipping thresholds. Chargebee saw 40% AOV lift through personalized cross-sell recommendations.
- Increase purchase frequency: Subscription offers, replenishment reminders, loyalty programs.
- Extend customer lifespan: Build brand affinity, create community, give customers reasons to stay.
For consumable categories—supplements, skincare, haircare, food—replenishment is the primary LTV driver. Kapiva, for example, builds LTV through health programs that create recurring supplement purchases, not just one-time buys.
The LTV:CAC Ratio
This is the single most important ratio in D2C.
| LTV:CAC Ratio | What It Means |
|---|
| Below 1:1 | You're losing money on every customer |
| 1:1 – 2:1 | Barely covering acquisition costs, likely unsustainable |
| 3:1 | Healthy—industry standard benchmark |
| 4:1+ | Excellent, with room to scale or invest in growth |
| 8:1+ | May be under-investing in acquisition |
Most early-stage D2C brands in India operate at 1.5:1 to 2:1 and wonder why they're always cash-strapped despite growing revenue. The unit economics simply don't support the growth rate.
How to improve the ratio:
- Lower CAC through better CVR and more efficient channels
- Raise LTV through higher AOV and better retention
- Fix both simultaneously—that's where compounding happens
Contribution Margin: The Number That Actually Matters
Many D2C founders confuse gross margin with contribution margin. They're not the same.
Gross margin = Revenue minus Cost of Goods Sold (COGS)
Contribution margin = Revenue minus all variable costs:
- COGS
- Shipping and fulfillment
- Payment processing fees
- Returns and replacements
- Packaging
For Indian D2C brands, COD returns are a significant variable cost that US benchmarks ignore. COD orders typically have 15–25% return rates (vs. 5–8% for prepaid). If you're heavy on COD, your effective contribution margin is lower than your gross margin suggests.
Example:
- Revenue per order: ₹900
- COGS: ₹270 (30%)
- Shipping: ₹60
- Payment processing: ₹18
- Returns provision (15% of COD orders at 60% COD mix): ₹32
- Packaging: ₹20
- Contribution margin: ₹500 (55.5%)
This is the number to optimize. Reducing COD return rates (through better product descriptions, sizing guides, expectation-setting) directly improves contribution margin.
Payback Period: The Cash Flow Reality
Even a healthy LTV:CAC ratio doesn't help if cash runs out before customers repurchase.
Payback Period = CAC / Monthly Gross Profit per Customer
If CAC is ₹1,200 and a customer generates ₹400 in gross profit on their first order, with a second order expected at month 4 generating another ₹400:
- After month 1: ₹400 recovered, ₹800 outstanding
- After month 4: ₹800 recovered, ₹400 outstanding
- After month 7: ₹1,200 recovered—payback achieved
A 7-month payback period is manageable for a funded brand but dangerous for a bootstrapped one. Shortening it means either lowering CAC (better CVR) or increasing first-order value (better AOV).
Tactics to shorten payback:
- Upsell at cart and checkout: Adding one cross-sell item to the cart raises AOV without raising CAC
- First-order discount tied to subscription: ₹100 off if they subscribe—the subscription revenue arrives faster than repeat purchase would
- Improve CVR specifically for high-AOV products: Test which products drive better economics, not just better volume
Festive Season Impact on Unit Economics
India's festive calendar (Diwali, Navratri, Holi, Raksha Bandhan) creates temporary distortions in unit economics that founders need to plan around.
During Diwali:
- Traffic costs spike as every brand competes for the same eyeballs
- CAC can rise 30–50% due to CPM inflation
- But AOV also rises as customers buy gifts and gifting sets
- CVR among warm audiences stays high; cold traffic CVR can drop
Festive-season strategy:
- Don't judge annual unit economics by festive performance alone
- Run your most efficient channels, not your largest spend channels, during peak
- Use this period to acquire customers, then invest in retention through January
- Personalize for gift-givers vs. personal buyers—these are different segments with different needs
Nykaa's festive strategy is instructive: they focus on warm audiences and existing customers during peak, rather than trying to win cold traffic in a saturated market.
Tips / Best Practices
- Know your LTV:CAC by cohort, not blended. Customers acquired via influencer campaigns often have different LTV than those from search ads. Treat them differently.
- Track contribution margin, not gross margin. Include returns, COD fees, and fulfillment in your variable cost calculation.
- Calculate payback period before scaling any channel. If payback exceeds 9 months, prioritize retention improvements before spending more on acquisition.
- Segment LTV by first product purchased. Customers who start with your hero product may have 2x the LTV of those who start with a promotional item.
- Use CVR improvement as a CAC reduction tool. A/B testing your product pages is one of the best investments in unit economics available.
- Build separate models for COD and prepaid customers. Return rates differ significantly; treat them as different economic segments.
- Review unit economics monthly, not quarterly. In a fast-moving D2C market, problems compound quickly if caught late.
- Test bundle pricing to raise AOV. Higher first-order value shortens payback period and improves LTV:CAC in one move.
- Account for festive season distortions. Build a 12-month rolling view rather than optimizing for peak periods.
- Set a minimum LTV:CAC target of 3:1 as a non-negotiable. Below this, your business model is subsidizing customers, not building value.
Key Takeaways
- D2C unit economics—CAC, LTV, contribution margin, payback period—are the true health indicators of a direct-to-consumer brand. Revenue growth without healthy unit economics is a warning sign, not a success signal.
- The LTV:CAC ratio should be at least 3:1. Below 2:1, the brand is likely unprofitable on a per-customer basis.
- Improving conversion rate is the most powerful way to reduce CAC without cutting ad spend. Bellavita's 11% CVR improvement with CustomFit.ai directly improved their CAC.
- Indian D2C brands must account for COD economics—higher return rates, different payment fee structures, and UPI preferences affect contribution margin significantly.
- Festive season distorts unit economics in both directions. Plan 12-month cohorts, not festival-to-festival comparisons.
- Retention is the most underinvested area in Indian D2C. Improving repeat purchase rate from 20% to 35% can transform LTV:CAC from 2:1 to 3.5:1.
Links: Customer Acquisition Cost | Lifetime Value | Conversion Rate | Average Order Value | D2C Brand Growth Pillar | D2C Brands Plateau Fix