From the conversion glossary
Concepts referenced in this article, defined.
Concepts referenced in this article, defined.
Run rigorous A/B tests and personalize every visit on Shopify or any storefront — no engineers required.
Every additional second your ecommerce page takes to load costs you sales — not as a theoretical concern, but as a measured, documented reality across thousands of ecommerce sites. A Deloitte/Google study found that a 0.1-second improvement in mobile load time increases conversion rates by 8% on retail sites. A page loading in 1 second converts approximately 3x as many visitors as the same page loading in 5 seconds. For a D2C brand doing ₹1 crore/month in revenue, a 2-second load time improvement can represent ₹15–25 lakh in additional monthly revenue without changing a single ad or product.
The research connecting page speed to conversion rate is consistent across studies:
Google/SOASTA (2017): Sites that load in 5 seconds have 70% longer average sessions and 35% lower bounce rates than sites loading in 19 seconds. Mobile pages that load 1 second faster see a 27% increase in conversion rate.
Deloitte/Google (2019): A 0.1-second improvement in load time drives an 8% uplift in conversion rate, 10% increase in page views, and 8% reduction in bounce rate across retail mobile sites.
Cloudflare research: Each additional 100ms of latency reduces conversion rate by 1%. At the scale of a D2C brand with 50,000 monthly sessions, that's real revenue.
Indian market context: Indian 4G speeds average 15–25 Mbps, but actual page load experience on budget smartphones (which account for 60%+ of Indian mobile traffic) is significantly slower due to device processing limitations. A page that loads in 2.5 seconds on a flagship phone may take 5–6 seconds on a mid-range device.
Google's Core Web Vitals are the specific page speed metrics that matter most for both conversion rate and search ranking:
What it is: The time until the largest visible element (usually your hero image or headline) loads. Target: Under 2.5 seconds. Why it matters for CVR: LCP is the first visual feedback a visitor gets that "something is loading." If LCP is slow, visitors bounce before your product is even visible. Typical cause: Unoptimized hero images, render-blocking CSS, or slow server response time.
What it is: How quickly the page responds when a visitor tries to interact with it (click a button, tap a link). Target: Under 200ms for INP. Why it matters for CVR: If a visitor taps "Add to Cart" and nothing happens for 1+ second, they often tap again (causing double-add) or assume the page is broken and abandon. Typical cause: Heavy JavaScript from third-party analytics, chatbots, or marketing tools blocking the main thread.
What it is: How much the page layout shifts unexpectedly while loading. Target: Under 0.1. Why it matters for CVR: If the "Add to Cart" button shifts position while loading and a visitor taps the wrong element, it breaks their conversion flow. Layout shifts are also disorienting and signal a poorly built page. Typical cause: Images without defined dimensions, dynamically loaded content (reviews, personalization widgets) that push other elements around.
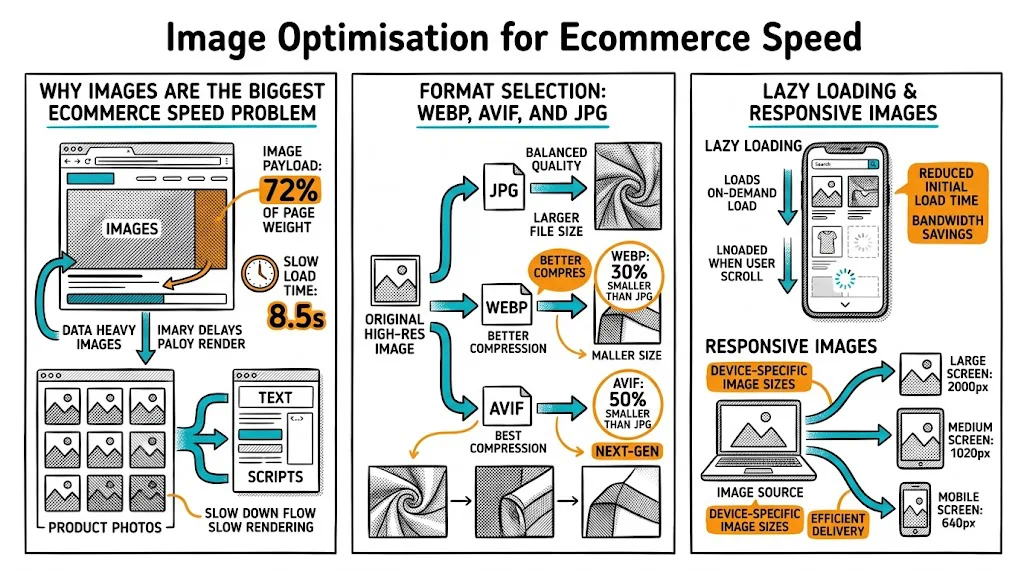
Product images are typically 60–80% of total page weight on ecommerce sites. A product page with ten 2MB JPEG images loads at 20MB+ — on a mobile 4G connection, that's unacceptable.
Fix: Convert all product images to WebP format (70–80% smaller than JPEG at equivalent quality) and implement lazy loading for images below the fold. Target under 150KB per product image.
The average D2C Shopify store has 15–25 third-party scripts running: analytics (GA4, Facebook Pixel, Hotjar), chat widgets, review tools, pop-up tools, loyalty apps, and more. Each script adds network requests and can block rendering.
Fix: Audit your installed apps in Shopify. Remove any app you haven't used in 30 days. For essential scripts, load them asynchronously or defer them until after the page is interactive. Use Google Tag Manager to consolidate and control script loading.
Stylesheets and JavaScript files that load in the <head> block the browser from displaying any content until they're fully downloaded and processed.
Fix: Move non-critical JavaScript to load after the page content ("defer" attribute). Inline critical CSS (the styles needed to render above-the-fold content) and load the rest asynchronously.
Time to First Byte (TTFB) — how long the server takes to respond to a browser request — is often the forgotten element. If your server responds in 800ms, you've used 800ms before a single byte of page content has loaded.
Fix: Use a CDN (Cloudflare, Fastly, or Shopify's built-in CDN for static assets). Enable server-side caching. Optimize your database queries if you're on WooCommerce or a custom platform.
Many D2C Shopify stores use feature-rich themes with complex layouts, animations, and page builder elements. These themes often include extensive JavaScript and CSS for features you're not using.
Fix: Audit your theme's unused features and disable them. Consider a performance-first theme (Dawn for Shopify is well-optimized out of the box). If using a page builder, test whether it's adding significant load time vs. a native theme implementation.
Google PageSpeed Insights (pagespeed.web.dev): Free, shows Core Web Vitals for both mobile and desktop, with specific improvement recommendations. Run it on your homepage, top product pages, and checkout page.
Google Search Console (Core Web Vitals report): Shows Core Web Vitals performance aggregated across all your indexed pages, with URLs flagged as "Poor" or "Needs Improvement." This is your prioritization list.
Chrome DevTools Performance tab: For technical teams, the Waterfall chart shows exactly which resources are loading slowly and what's blocking rendering.
WebPageTest.org: Allows testing from specific locations (India) and connection speeds (4G mobile), giving you data most representative of your actual users.
Work through this in priority order:
Week 1: Quick wins (no code required)
Week 2: Script optimization
Week 3: Core Web Vitals targeting
Ongoing: Measurement and testing After each optimization, run a conversion rate comparison. Use an A/B test if possible: route 50% of traffic to the original page and 50% to the optimized version, measuring add-to-cart rate and RPV as primary metrics.
Page speed and CRO aren't independent — they interact. A beautiful A/B test variant that loads in 5 seconds will lose to a mediocre control that loads in 2 seconds. When you're running A/B tests and one variant consistently underperforms, always check whether it's loading slower than the control.
Conversely, improving page speed is itself one of the highest-ROI CRO actions you can take — often more impactful than any headline or image test, especially for mobile-heavy audiences.
For your A/B test program, treat page speed as a prerequisite: get your Core Web Vitals to "Good" before running conversion tests, so your test results reflect genuine UX differences rather than load time artifacts.
Measure on real Indian devices and connections. A page that scores 90+ on PageSpeed Insights may still feel slow on a Realme or Redmi device on a patchy 4G connection in Tier 2 cities. Use WebPageTest with an India server location and slow 4G setting for realistic measurements.
Every Shopify app costs speed. The convenience of one-click apps has a performance price. Before installing any new app, check whether there's a leaner implementation (via Google Tag Manager or a developer snippet) that achieves the same outcome without the app's full JS bundle.
Speed regression test after every theme update. Theme updates often reintroduce CSS and JS from features you'd previously disabled. Run PageSpeed Insights after every theme or major app update.
Don't sacrifice image quality for speed. You can usually get WebP images under 150KB while maintaining enough visual quality for product pages. If your images are blurry after compression, they'll hurt CVR despite the speed improvement. Find the quality-speed balance.
Consider a separate mobile experience for very slow pages. If your main product page genuinely can't be optimized below 4 seconds on mobile, consider an AMP version or a simplified mobile-specific product page template that loads in under 2 seconds.
Related reading: Google Ads Quality Score & Landing Page CRO | Landing page optimization guide | Bounce rate glossary.