From the conversion glossary
Concepts referenced in this article, defined.
Concepts referenced in this article, defined.
Run rigorous A/B tests and personalize every visit on Shopify or any storefront — no engineers required.
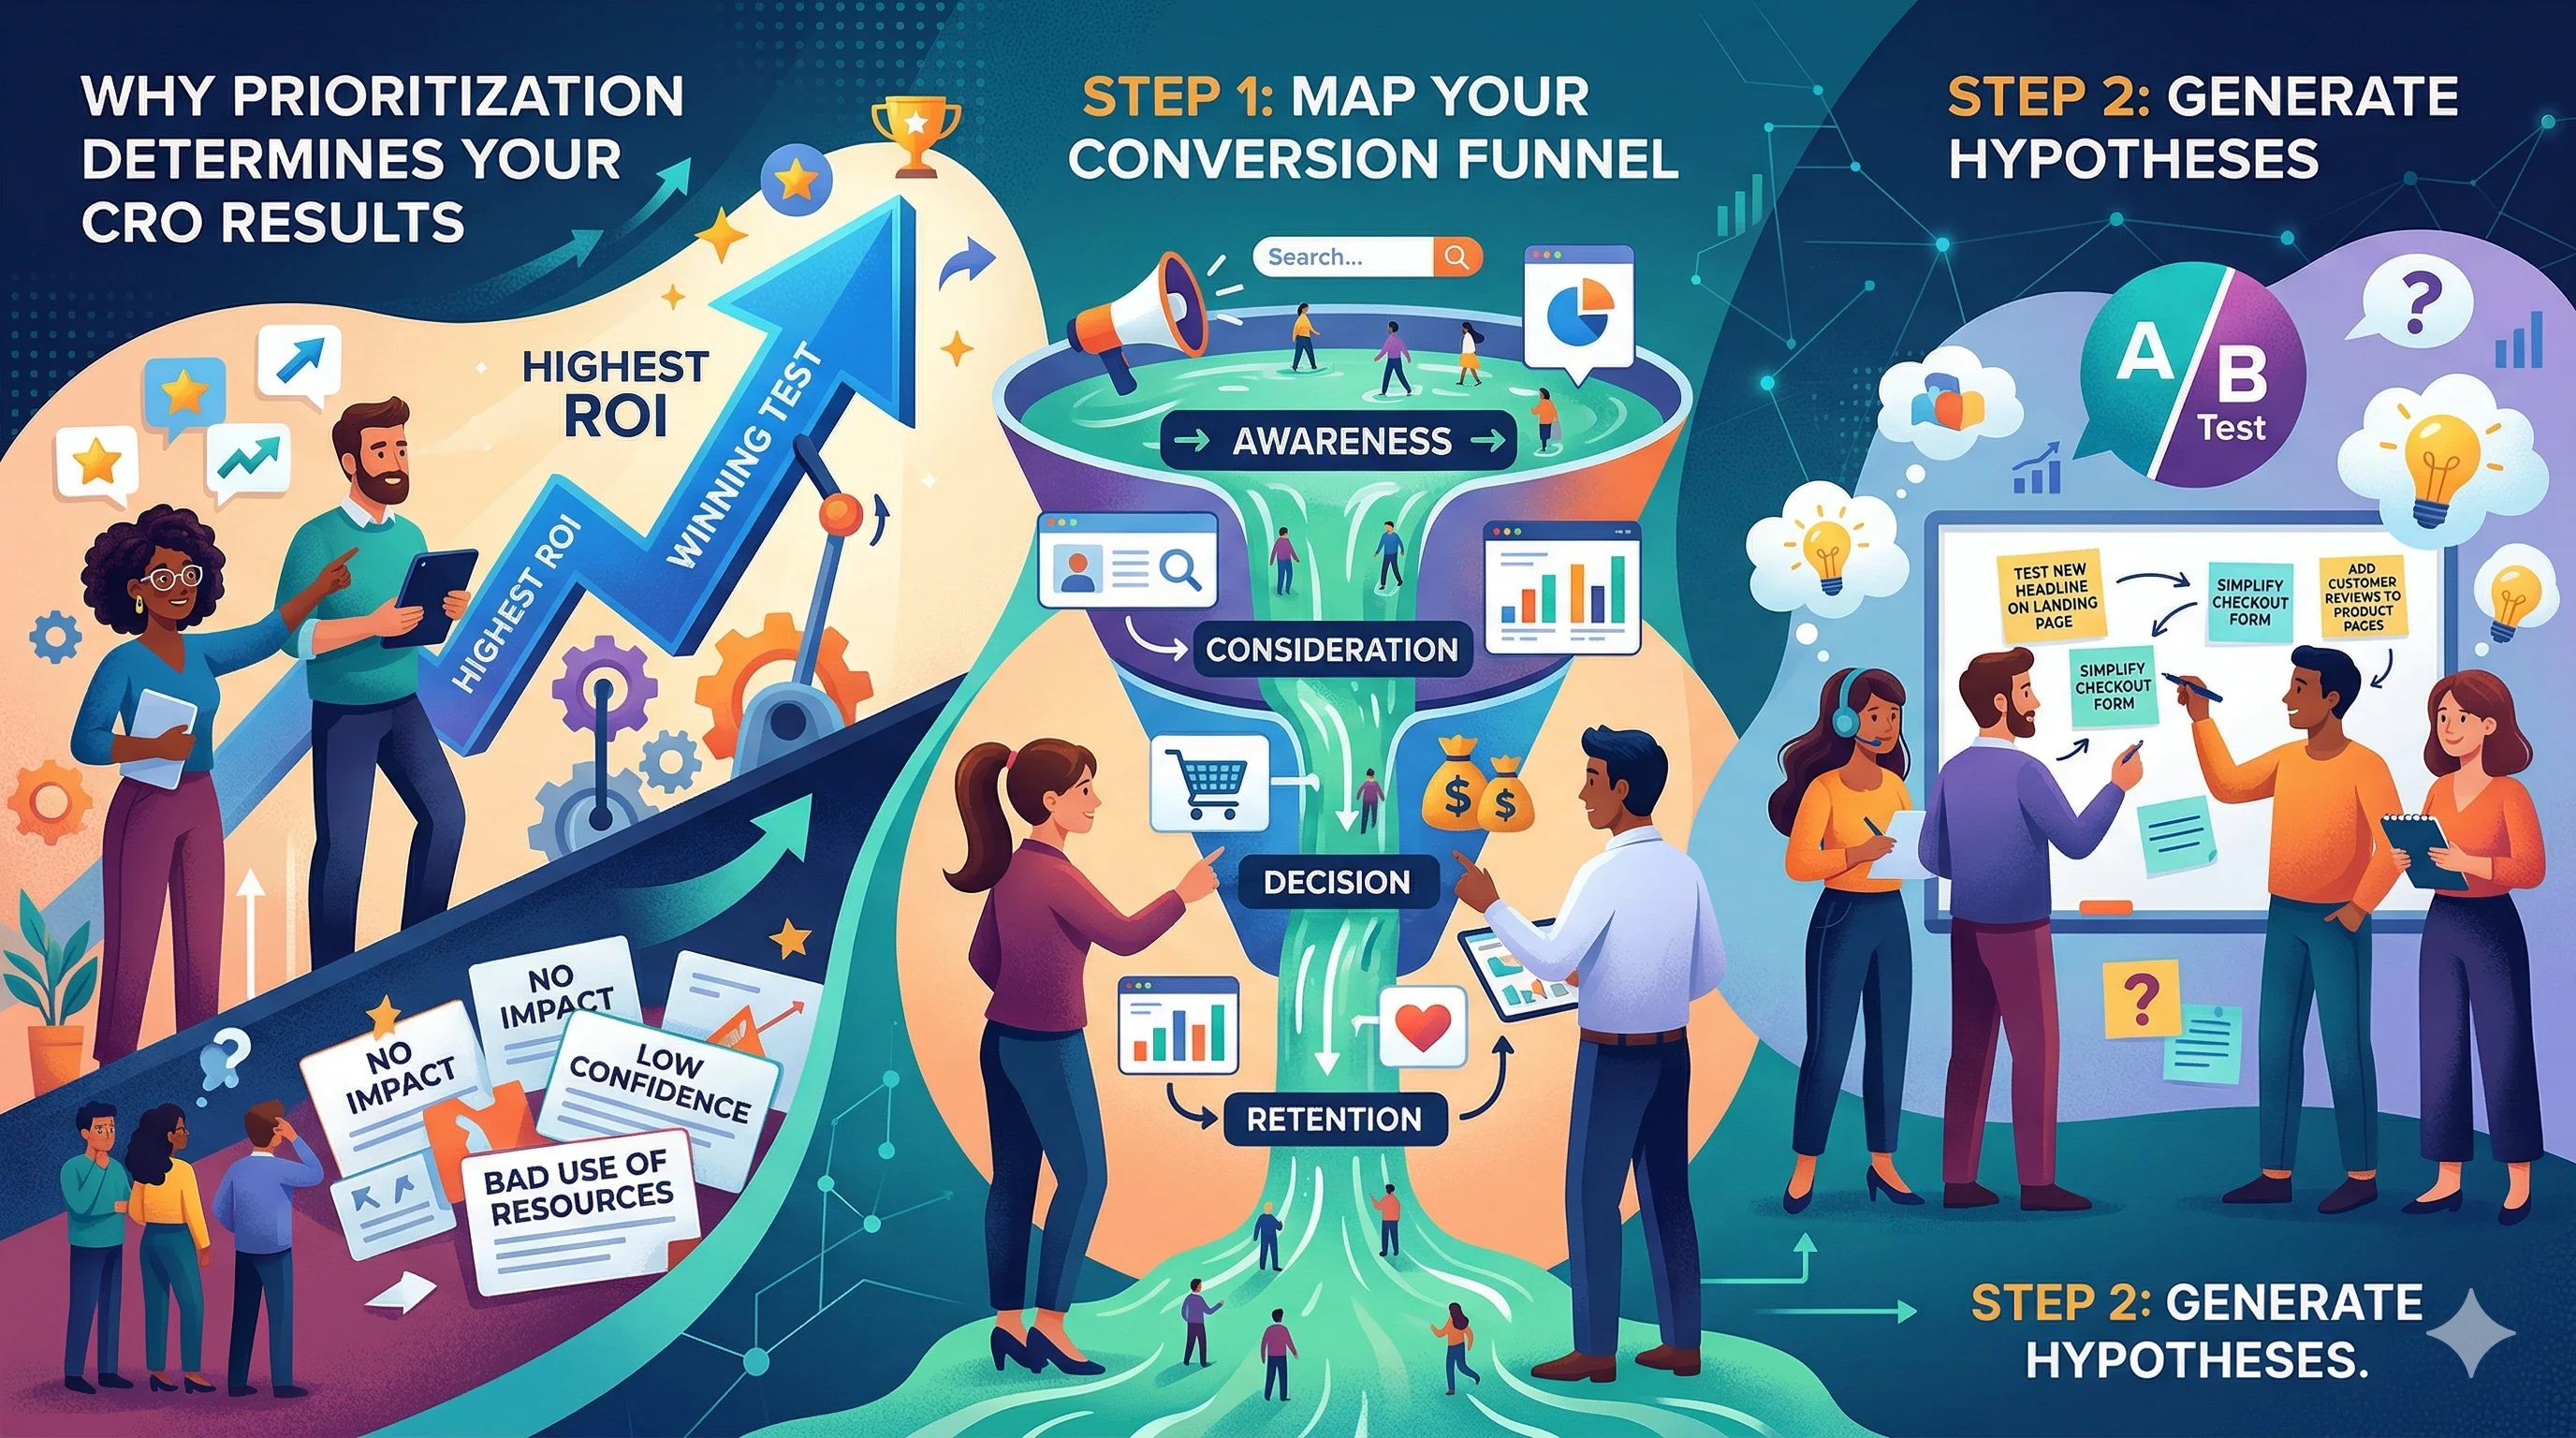
An experimentation roadmap answers one critical question: given limited time and traffic, which tests will move the needle most? Without a roadmap, teams test whatever is top of mind—often small changes on low-traffic pages that take months to conclude and yield marginal results. With a roadmap, you systematically identify your biggest conversion leaks, generate hypotheses to fix them, and run tests in order of potential impact. This guide shows you how to build and maintain one.
Every test you run costs something: traffic (which can't be recaptured), time (to design, build, and monitor), and opportunity cost (what else you could have tested). Running low-impact tests on low-traffic pages is expensive in all three ways.
The brands that compound conversion rate improvements over time do so because they relentlessly test the right things in the right order. A 5% lift on your highest-traffic page is worth 50x the same lift on a niche category page. Prioritization is the multiplier.
Before you can prioritize what to test, you need a clear picture of where you're losing visitors.
Build a basic funnel map in GA4:
For each step, calculate:
Prioritization formula: Impact = Drop-off rate × Volume
A step with 70% drop-off but only 100 visitors per week is less valuable to test than a step with 25% drop-off and 5,000 visitors per week. The math: 70 vs. 1,250 people dropping off. Fix the bigger leak first.
For each major drop-off point, generate 3–5 hypotheses. A hypothesis is not "let's test the button color." It's a specific, rationale-backed idea:
Hypothesis structure: "Because [specific observation], we believe [specific change] will improve [specific metric] for [specific audience]."
Sources for hypothesis generation:
GA4 data:
Heatmaps and session recordings:
Customer surveys:
Support tickets and reviews:
Competitor and best-practice analysis:
Two frameworks for scoring: PIE and ICE. (Full comparison →)
PIE Framework:
| Criterion | Score (1–10) |
|---|---|
| Potential — How much can this improve conversion? | |
| Importance — How much traffic does this affect? | |
| Ease — How easy is this to implement? |
Average the three scores. Test in descending order.
Example scoring:
| Test Idea | Potential | Importance | Ease | PIE Score |
|---|---|---|---|---|
| Mobile checkout simplification | 8 | 9 | 6 | 7.7 |
| Product page trust badge test | 6 | 9 | 9 | 8.0 |
| Homepage hero image variant | 5 | 10 | 8 | 7.7 |
| Category page filter UX | 7 | 6 | 4 | 5.7 |
| Exit intent popup | 6 | 7 | 8 | 7.0 |
Run the trust badge test first (highest PIE score), even though homepage traffic is highest—ease and importance combination wins.
A simple roadmap structure:
Columns: Test ID | Hypothesis | Page | Primary Metric | Priority Score | Status | Start Date | End Date | Result
Statuses:
Keep 3–5 tests in "Live" status at any time (assuming traffic supports concurrent tests without interference). Keep 10–20 in "Prioritized" so you always have a next test ready.
Test velocity—how many tests you run per month—compounds your learning rate. A team running 4 tests per month learns 4x faster than one running 1 per month. Over a year, that's 48 vs. 12 learnings.
What determines your test velocity:
Weekly cadence:
Monthly cadence:
Quarterly cadence:
Testing opinions, not hypotheses: "Let's test a different header image because the CEO prefers it" is not a hypothesis. Every test needs a data-backed rationale.
HIPPO-driven priority changes: The highest-paid person's opinion shouldn't override PIE scores. If leadership wants to run a test, add it to the backlog, score it, and let the process determine when it runs.
Stopping tests at promising interim results: Early wins are noise. A test that shows +15% at day 3 may revert to +2% or −3% by the time it reaches significance. The roadmap should have a minimum run time (typically 2 weeks minimum, or significance + 2 weeks).
Ignoring losing tests: A test that doesn't improve conversion is not a failure—it's data. Document why you thought it would work, why it didn't, and what you'd test next as a result.
Running too many concurrent tests: If your site has 10,000 monthly sessions and you're running 5 concurrent tests, each test is getting 2,000 sessions per test—barely enough for most tests to reach significance in a reasonable timeframe. Better to run 2 focused tests concurrently and conclude them faster.
Your experimentation roadmap is also a stakeholder communication tool. Sharing it with leadership monthly communicates:
Teams that share their roadmap transparently get more organizational support for testing—which means more budget, faster approvals, and a culture that values data over opinion.
CustomFit.ai's dashboard shows all active and concluded tests in one place—essentially a live view of your roadmap status. For Shopify brands:
This visibility means you can manage your testing roadmap and execution in the same tool, reducing the administrative overhead that slows many CRO programs.
Build your first test on CustomFit.ai →