From the conversion glossary
Concepts referenced in this article, defined.
Concepts referenced in this article, defined.
Run rigorous A/B tests and personalize every visit on Shopify or any storefront — no engineers required.
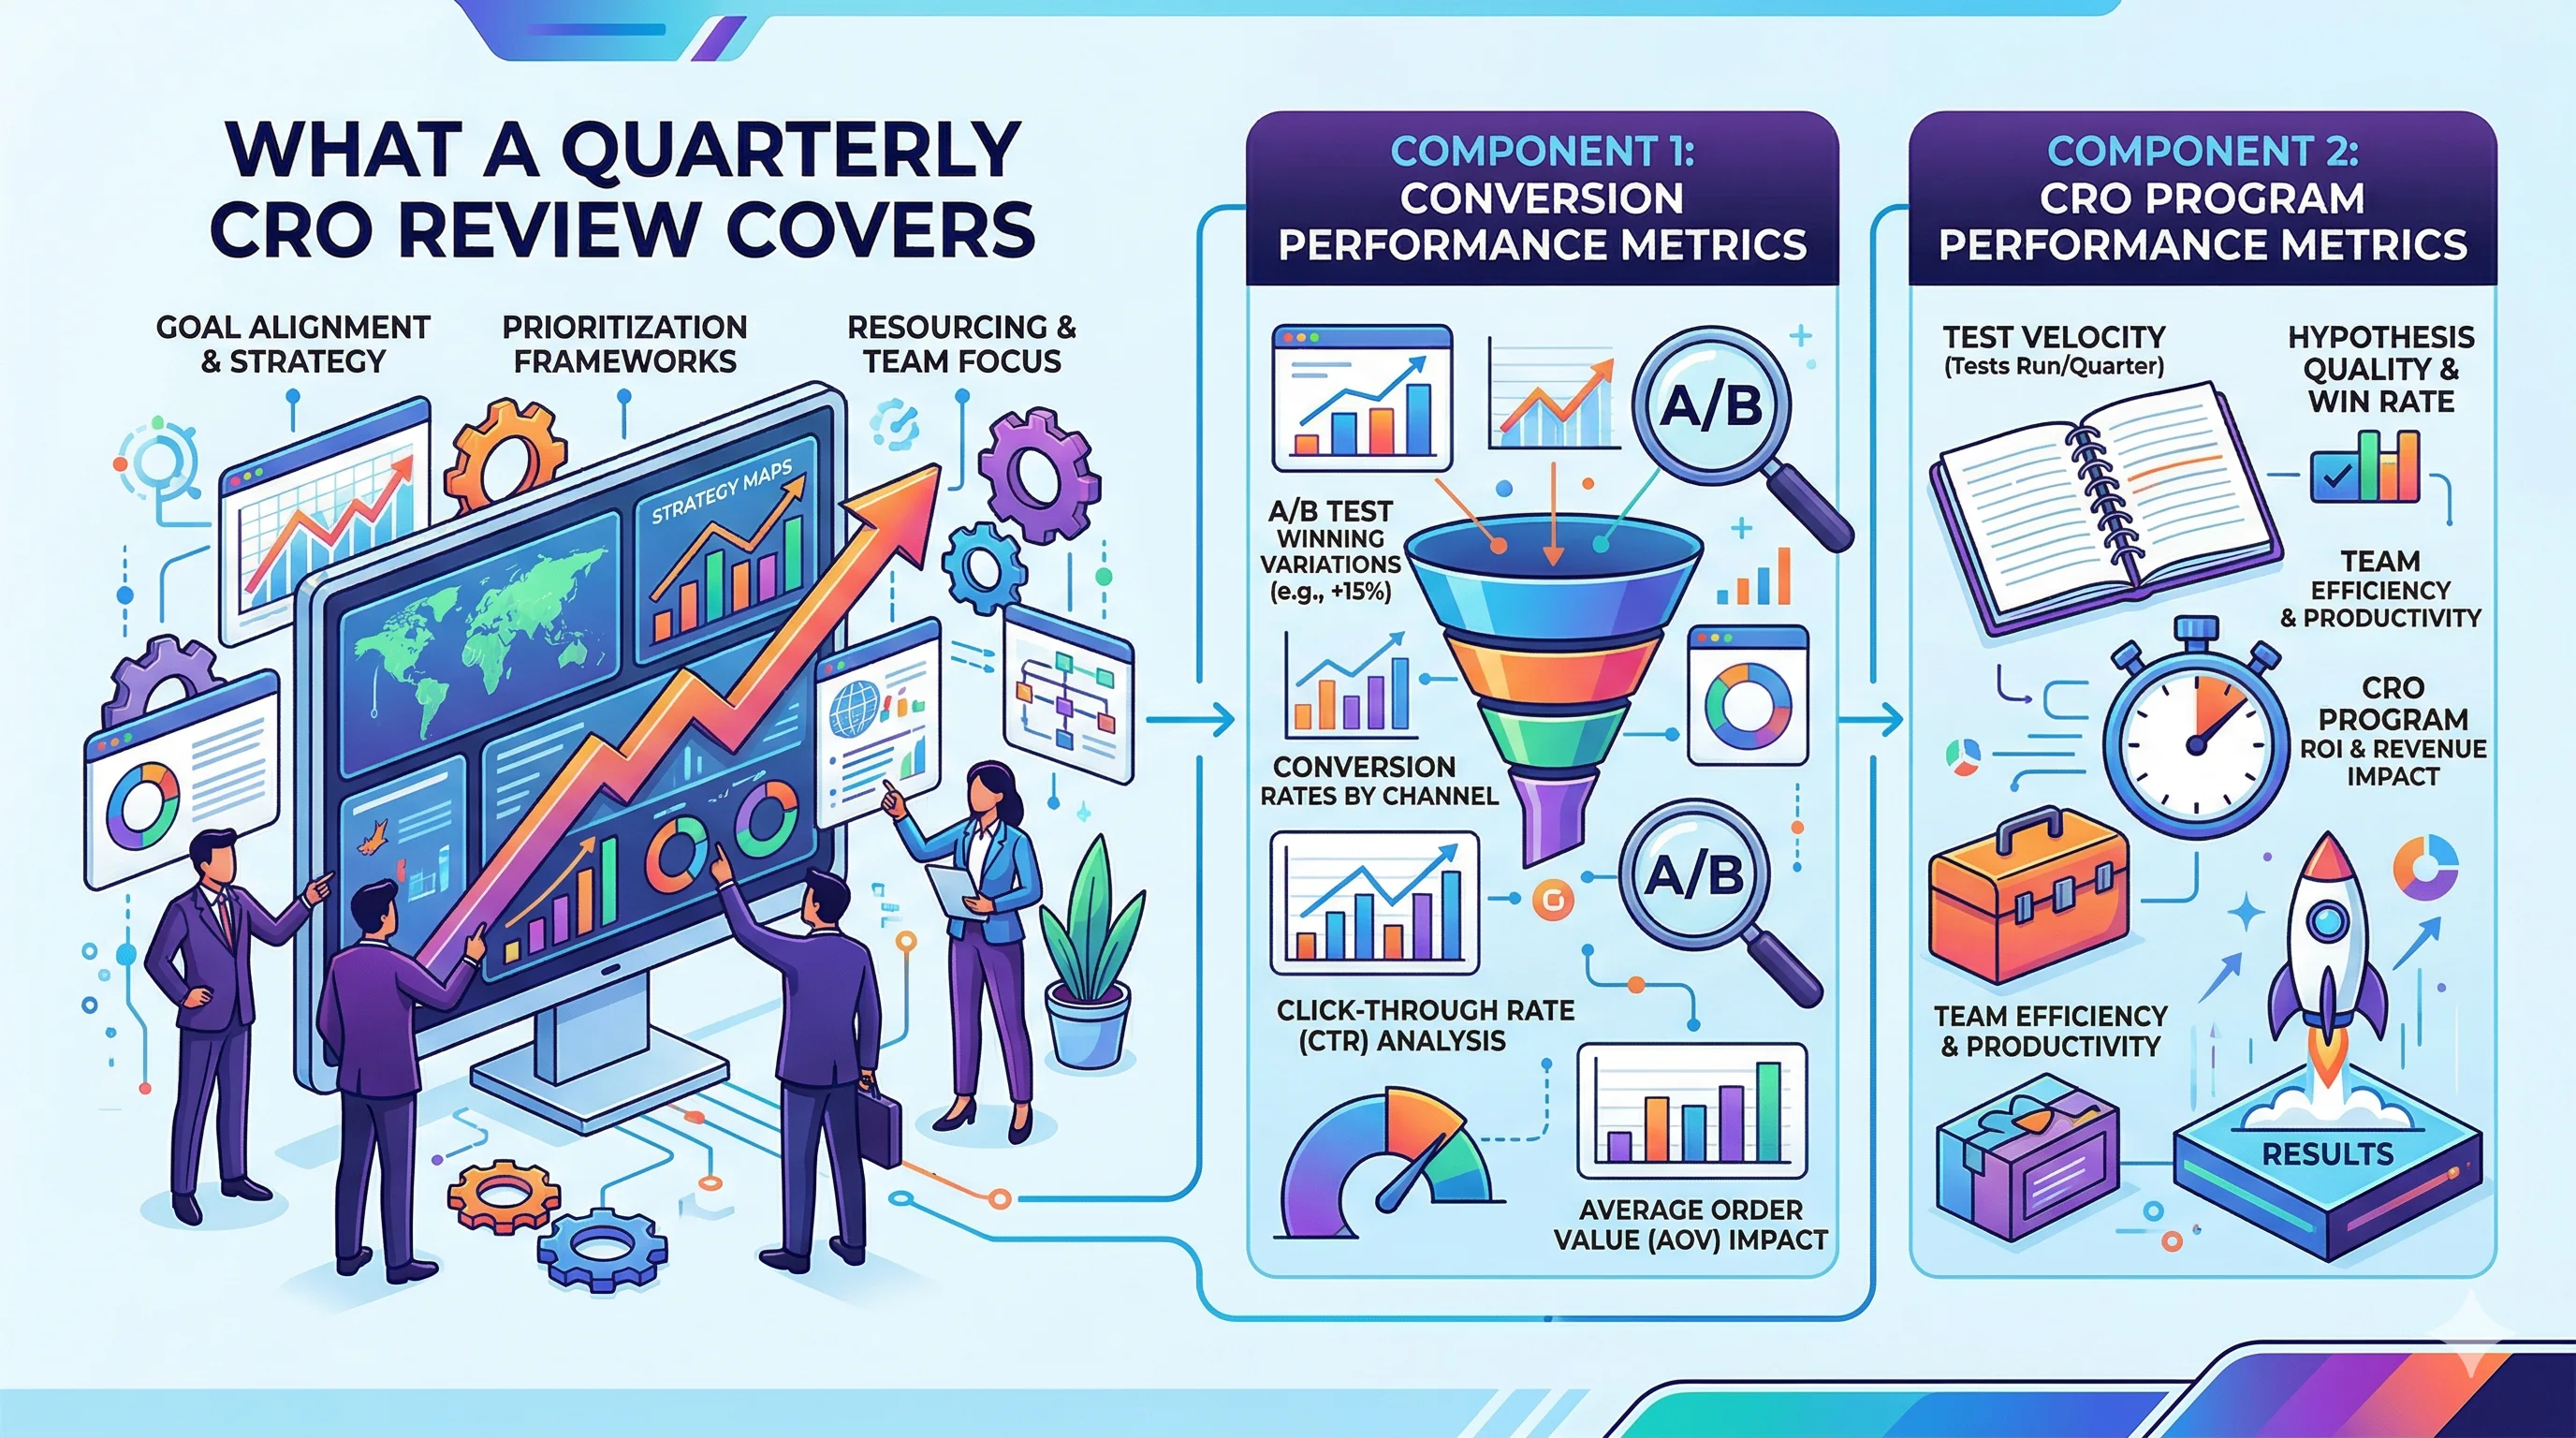
A quarterly CRO review is a structured assessment of your experimentation program's health and impact — measuring whether conversion rates are improving, whether your program is running at the right velocity, and what the testing results so far tell you about where to focus next. Done well, a quarterly review keeps leadership informed, adjusts priorities based on real data, and ensures the program continues to compound value throughout the year. Done poorly (or skipped), it leaves your program running on autopilot without accountability.
A quarterly review has three components:
The review should take 2–3 hours total, produce a one-page leadership summary, and drive concrete decisions about Q+1 priorities.
Pull these metrics for the quarter and compare to:
Overall store conversion rate: Your primary indicator. Calculate as: total orders / total sessions × 100.
Watch for: QoQ trends and seasonal patterns. Q4 CVR may naturally be higher due to Diwali traffic; comparing to Q4 last year is more meaningful than comparing to Q3.
Mobile CVR: Separate from overall because mobile conversion typically runs 30–50% below desktop. If your mobile CVR is improving relative to desktop, your mobile UX optimizations are working.
New visitor CVR vs. returning visitor CVR: If your new visitor CVR is dropping, it may indicate acquisition traffic quality changes rather than site issues. If returning visitor CVR is dropping, look at retention and product satisfaction.
CVR by traffic source:
Traffic source CVR shifts often reveal marketing mix changes or quality shifts, not site optimization issues.
Track the conversion rate at each funnel stage:
| Stage | Q metric | QoQ change | YoY change |
|---|---|---|---|
| Landing → Category | X% | +/-Y% | +/-Z% |
| Category → PDP | X% | +/-Y% | +/-Z% |
| PDP → Add to Cart | X% | +/-Y% | +/-Z% |
| Add to Cart → Checkout | X% | +/-Y% | +/-Z% |
| Checkout → Purchase | X% | +/-Y% | +/-Z% |
A stage that's declining while others hold steady is your optimization priority for Q+1.
How many tests did you run this quarter?
| Metric | This Quarter | Q-1 | Q1 Target |
|---|---|---|---|
| Tests launched | N | N | N |
| Tests completed | N | N | N |
| Tests per month | N | N | N |
If velocity is below target, diagnose the bottleneck:
| Metric | This Quarter | Full Year |
|---|---|---|
| Tests with statistically significant results | N | N |
| Win rate (% producing significant improvements) | X% | X% |
| Average CVR lift from winning tests | X% | X% |
| Tests shipped to production | N | N |
A healthy win rate is 25–40%. If your win rate is below 20%, your hypotheses may not be evidence-based enough. Above 50% may indicate tests are being called before statistical significance.
For each test winner you shipped this quarter, calculate estimated annual revenue impact:
Formula: Estimated annual revenue impact = (variant CVR - control CVR) × monthly sessions on that page × AOV × 12
Example:
Total the impact estimates for all Q winners. This is your quarterly CRO ROI estimate.
Note the caveats: These are estimates. They assume consistent traffic, stable conversion environment, and no interaction effects from other changes. Present them with appropriate context but don't over-hedge — leadership needs a number to evaluate the program.
A healthy hypothesis library should always have 4–6 weeks of ready-to-test hypotheses.
Synthesize 3–5 key learnings from this quarter's test results. Not just "this test won" — but what did it teach you about your buyers?
Examples:
These learnings shape hypothesis quality for Q+1.
Based on funnel analysis and test learnings:
The leadership report should be one page. Here's the template:
Q[N] CRO REVIEW — [DATE]

RESULTS SUMMARY:
- Tests launched: [N] | Tests completed: [N]
- Significant improvements found: [N] tests
- Tests shipped: [N]
- Estimated annual revenue impact from Q[N] winners: ₹[X]

CONVERSION PERFORMANCE:
- Overall CVR: [X]% ([+/-Y]% vs. Q[N-1], [+/-Z]% vs. annual target)
- Mobile CVR: [X]% ([trend])
- Cart abandonment: [X]% ([trend])

PROGRESS VS. ANNUAL GOALS:
- Goal 1: [X]% vs. target [Y]% — [on track / ahead / behind]
- Goal 2: [X]% vs. target [Y]% — [on track / ahead / behind]

TOP 3 LEARNINGS:
1. [Learning from test result]
2. [Learning from test result]
3. [Learning from test result]

Q[N+1] PRIORITIES:
1. [Focus area and rationale]
2. [Focus area and rationale]
3. [Focus area and rationale]

ESTIMATED Q[N+1] TESTS: [N] (velocity target: [N]/month)
This format takes 10 minutes to read, answers leadership's key questions, and drives productive discussion about Q+1 priorities.
Preparation (1 hour): Pull all metrics, calculate program impact, update hypothesis library
Internal review (30 minutes): CRO team or program owner reviews data and drafts key learnings
Leadership presentation (30–45 minutes): Walk through the one-page report, highlight key learnings, present Q+1 plan, get alignment on resource requests
Post-review (30 minutes): Update annual CRO plan document, confirm Q+1 hypothesis priorities, adjust testing calendar if needed
Presenting statistics instead of business impact. "Our tests achieved 95% confidence across 12 experiments" means nothing to most stakeholders. "We estimate these test wins will generate ₹25 lakh in additional annual revenue" is meaningful.
Ignoring losing tests. A review that only covers wins misses half the value. Failed tests often contain the most important learnings for Q+1 hypothesis generation.
Not updating the annual plan. If Q results show you're behind on annual goals, the plan needs to adjust. Carry forward the annual plan unchanged regardless of Q results is management theater, not program management.
Skipping the review when things are going well. The review process is most valuable when the program is working well — it builds the institutional memory that sustains the program through leadership changes and team turnover.