From the conversion glossary
Concepts referenced in this article, defined.
Concepts referenced in this article, defined.
Run rigorous A/B tests and personalize every visit on Shopify or any storefront — no engineers required.
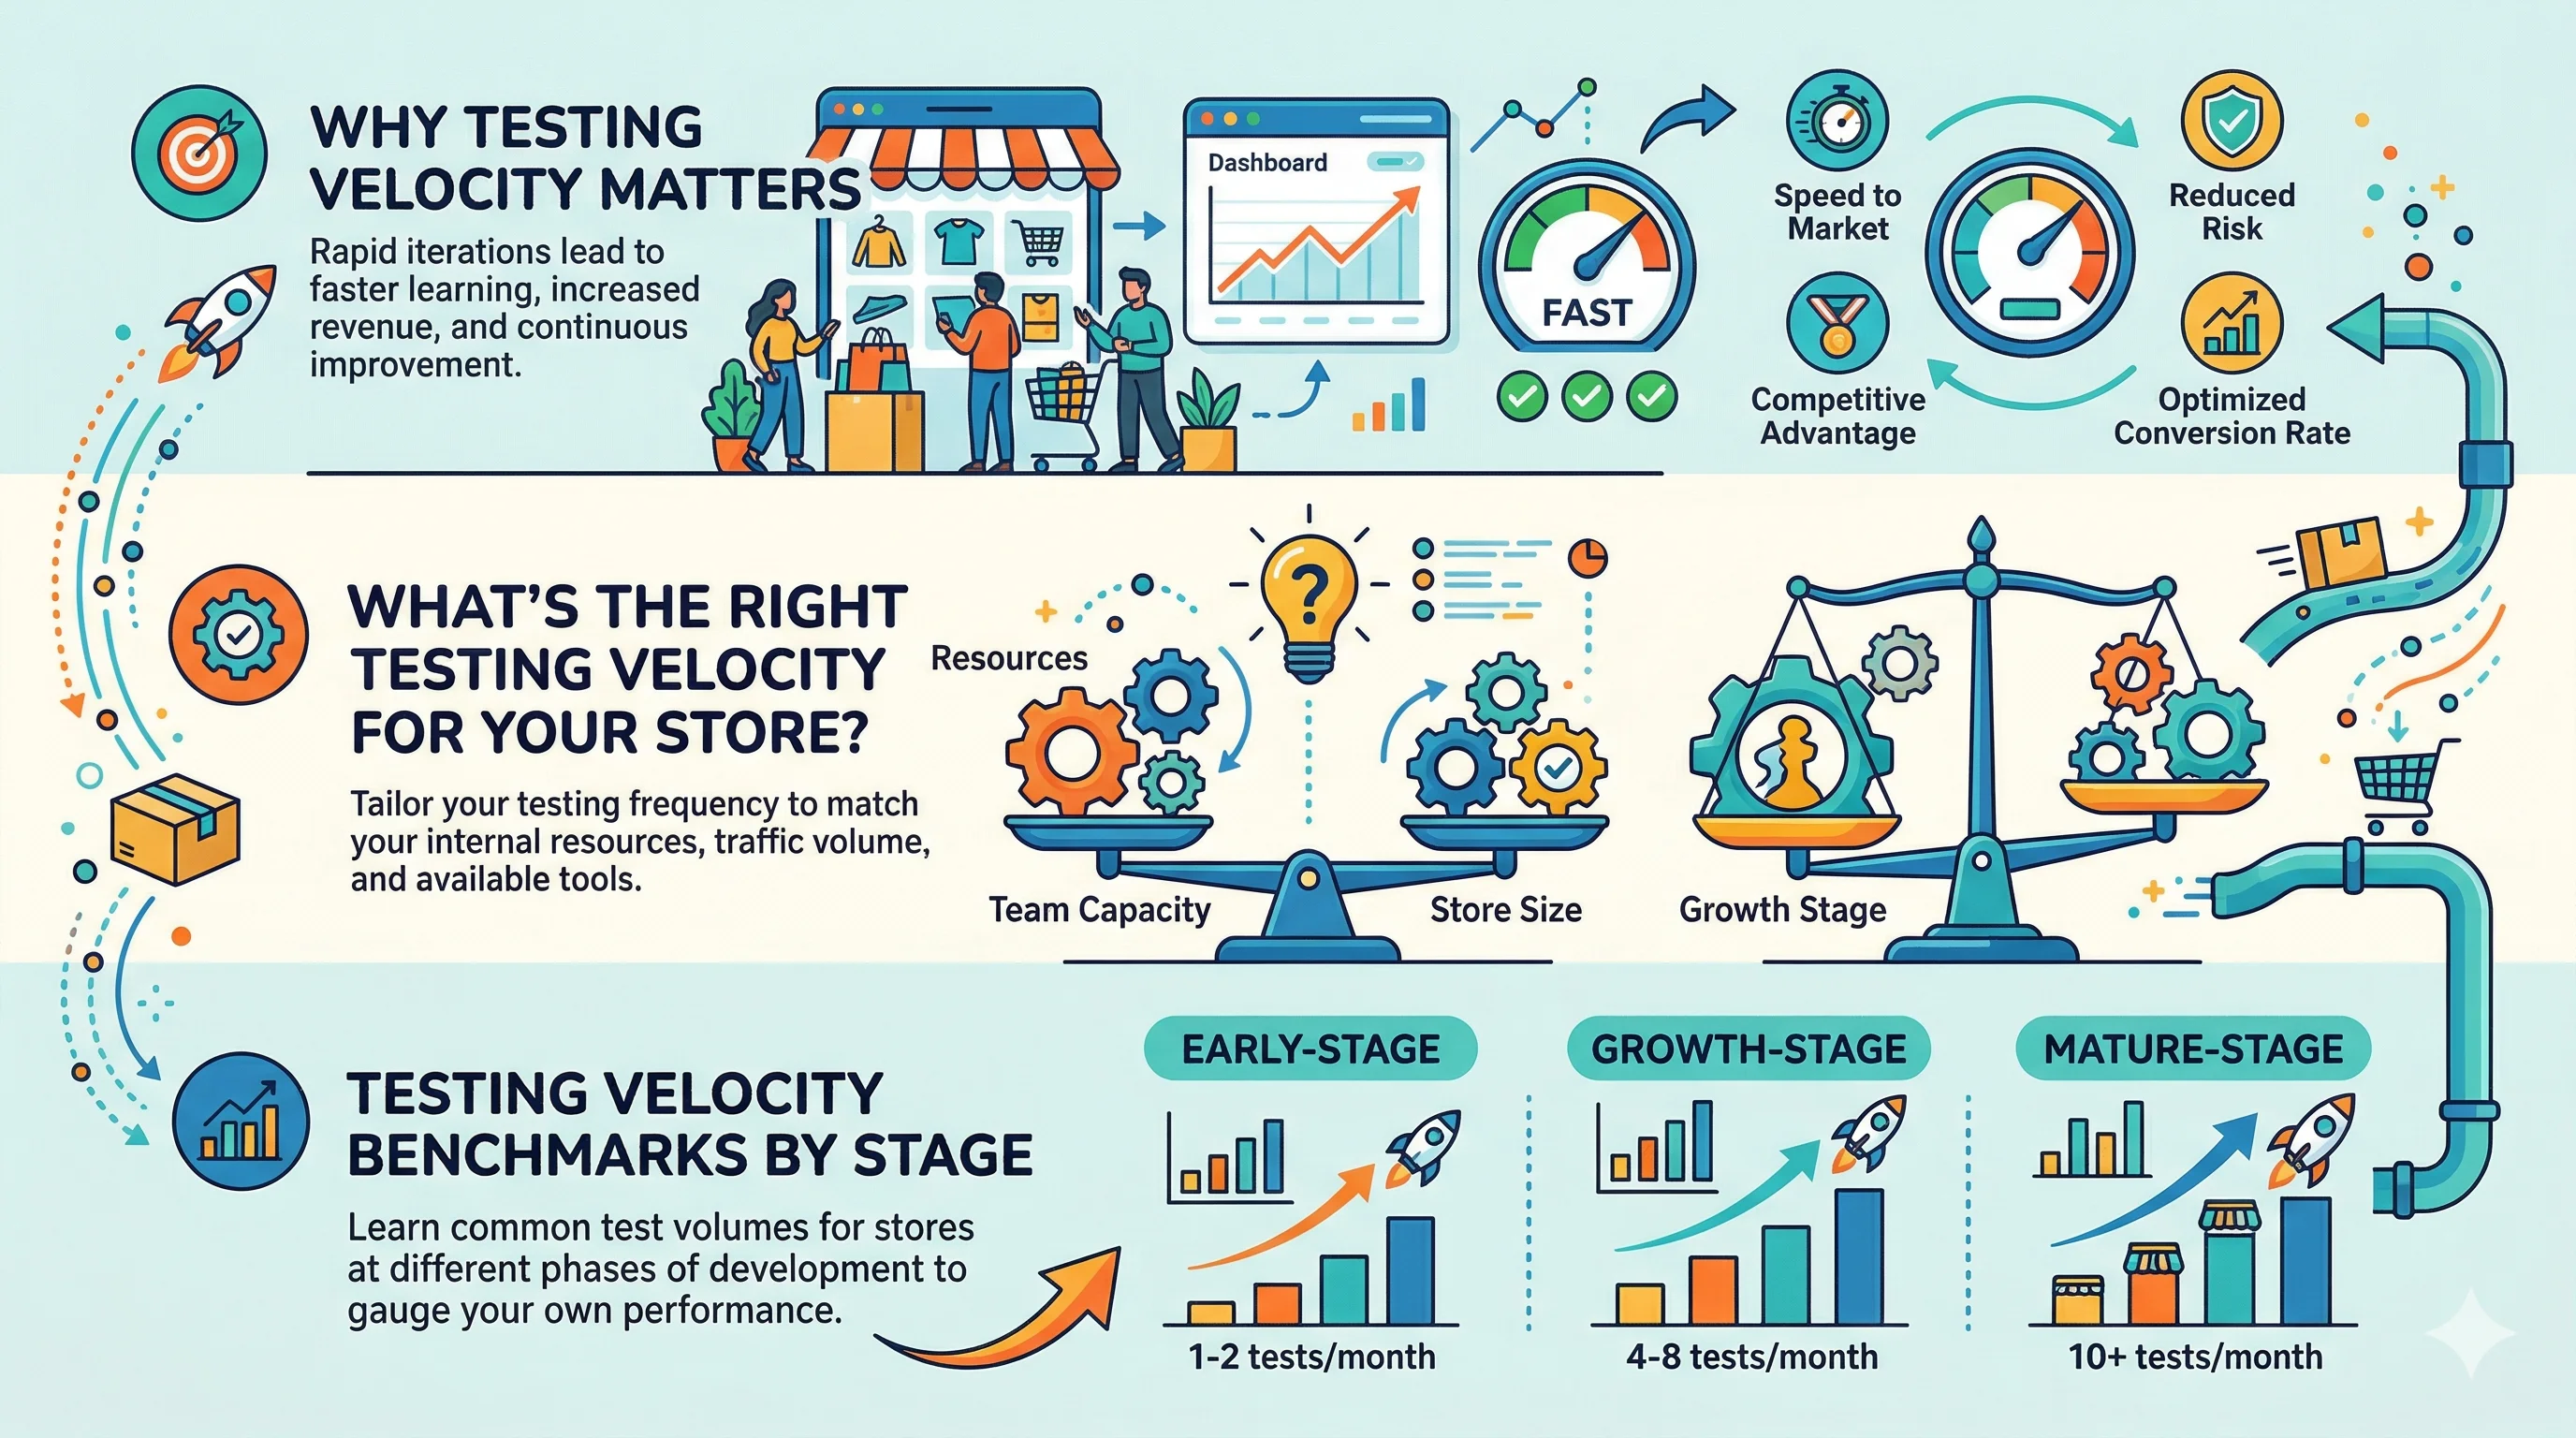
The brands that improve fastest aren't the ones with the biggest budgets — they're the ones that learn fastest. And learning speed in ecommerce is largely a function of testing velocity: how many A/B tests you can run per month with sufficient rigor to produce actionable insights. Get the velocity right and your site gets measurably better every month. Get it wrong — running too few tests (slow learning) or too many poor-quality ones (false signals) — and your experimentation program stalls or misleads. This guide covers the right velocity for your traffic and team, and how to get there.
Every A/B test is a learning opportunity. A test that shows a 15% CVR lift is a win — implement it. A test that shows no difference is also a win — you've eliminated a hypothesis and focused the next test on something more likely to matter. A test that reveals a previously hidden segment effect is a win — you now have a personalization opportunity.
The compounding effect of a high-velocity testing program is significant. A team running 4 tests per month generates 48 learning cycles per year. A team running 1 test per quarter generates 4. After 12 months, the high-velocity team has 12× more insights guiding their decisions.
Elite ecommerce testing programs (Booking.com, Amazon, Zalando) run 1,000+ tests per year across their platforms. You don't need that scale — but the principle holds: more disciplined tests = faster improvement.
Testing velocity targets should be anchored to two constraints:
Every A/B test needs a minimum number of visitors per variant to reach statistical significance. Run a test with insufficient traffic and you'll wait weeks or get a false result.
Minimum visitors per variant per week to detect a 10% CVR improvement at 95% confidence:
| Current CVR | Visitors needed per variant |
|---|---|
| 1.0% | ~8,000 |
| 2.0% | ~4,000 |
| 3.0% | ~2,500 |
| 5.0% | ~1,500 |
If your store gets 5,000 weekly visitors and you're running 3 tests simultaneously, each test gets ~1,600 visitors per week per variant. At a 2% baseline CVR, you'd need 2–3 weeks to reach significance. That's manageable.
If you're running 8 simultaneous tests at 5,000 weekly visitors, each test gets ~625 visitors per variant per week. You'd need 6+ weeks per test, and you're very likely to see interaction effects between tests. Scale back.
Rule of thumb: Run no more simultaneous tests than your traffic can meaningfully power in 2–3 weeks.
Tests don't run themselves. Each test requires:
Total: 8–18 hours per test. A single CRO manager working at 30% test-management capacity can run 4–6 tests per month. A 3-person CRO team can run 10–15 per month if implementation is fast.
The biggest multiplier on team capacity is removing the developer bottleneck. When every variation requires engineering time, testing velocity collapses — developers are rarely prioritizing CRO work over product features. Tools like CustomFit.ai that let marketers and CRO analysts build variations without code can 3–5× testing velocity for the same team size.
| Stage | Monthly Tests | Description |
|---|---|---|
| Just starting | 1–2 | Building the habit, establishing baselines |
| Growing program | 3–5 | Regular cadence, dedicated hypothesis backlog |
| Mature program | 6–10 | Prioritized roadmap, fast implementation, developer-free test building |
| Elite program | 10+ | Cross-functional culture, multiple concurrent programs |
Most ecommerce brands fall in the 1–4 tests/month range. Brands with dedicated CRO tools and no developer dependency can reach 5–10 per month. Above 10 per month requires either very high traffic or a large testing infrastructure.
The most common velocity killer. When your CRO or marketing team needs an engineer to build every test variation, tests get queued behind product features and development sprints. A test that should take 3 days to launch takes 3 weeks.
Fix: Use a no-code A/B testing tool that lets non-developers build variations through a visual editor. CustomFit.ai's visual editor lets marketers make changes to page elements, copy, and layout without touching HTML or CSS. Tests go from "waiting for developer" to "live in 2 hours."
Small and growing ecommerce brands often struggle to reach statistical significance in a reasonable timeframe. A test that needs 3 months of data to conclude is effectively useless — too many things change in 3 months to trust the results.
Fixes:
Teams without a structured hypothesis backlog spend test budget on whatever idea was most recently pitched — often by the HiPPO (Highest Paid Person's Opinion). This produces random tests rather than a systematic learning program.
Fix: Maintain a hypothesis backlog scored by the ICE framework (Impact × Confidence × Ease) or PIE framework (Potential × Importance × Ease). Score each hypothesis, rank by total, and work from the top. The team debates scoring, not which test to run next.
Higher velocity is only valuable if test quality is maintained. Poor-quality tests (no clear hypothesis, too many simultaneous changes, insufficient runtime) generate noise and can lead to wrong decisions.
Minimum quality standards per test:
A team running 8 poorly-formed tests per month will generate less actionable learning than one running 4 rigorous tests per month.
Month 1: Implement a no-code testing tool. Launch 2 tests using your highest-traffic page (probably your homepage or top PDP). Establish a documented test log.
Month 2: Build a 10-hypothesis backlog using ICE/PIE scoring. Launch 3 tests. Establish a weekly "test review" meeting (30 minutes) to share results and next steps.
Month 3: Increase to 4–5 tests. Begin training a second team member on the testing tool. Start tracking implementation rate (winning tests implemented / winning tests identified).
Month 6: Review 6-month cumulative revenue impact of implemented winners. Present to leadership. Use this to secure more resource for the program.
Related reading: Experimentation Culture Pillar | How to Present A/B Test Results to Stakeholders | CRO Documentation Templates | Statistical Significance