From the conversion glossary
Concepts referenced in this article, defined.
Concepts referenced in this article, defined.
Run rigorous A/B tests and personalize every visit on Shopify or any storefront — no engineers required.
Ecommerce KPIs are the numbers that tell you whether your business is growing, stagnating, or leaking. Most D2C founders track revenue and orders — but these two numbers hide more than they reveal. A store growing revenue while declining in conversion rate is spending more and more to get the same result. A store with growing orders but falling average order value is working harder for less profit per customer. These 25 KPIs give you a complete picture of your ecommerce health.
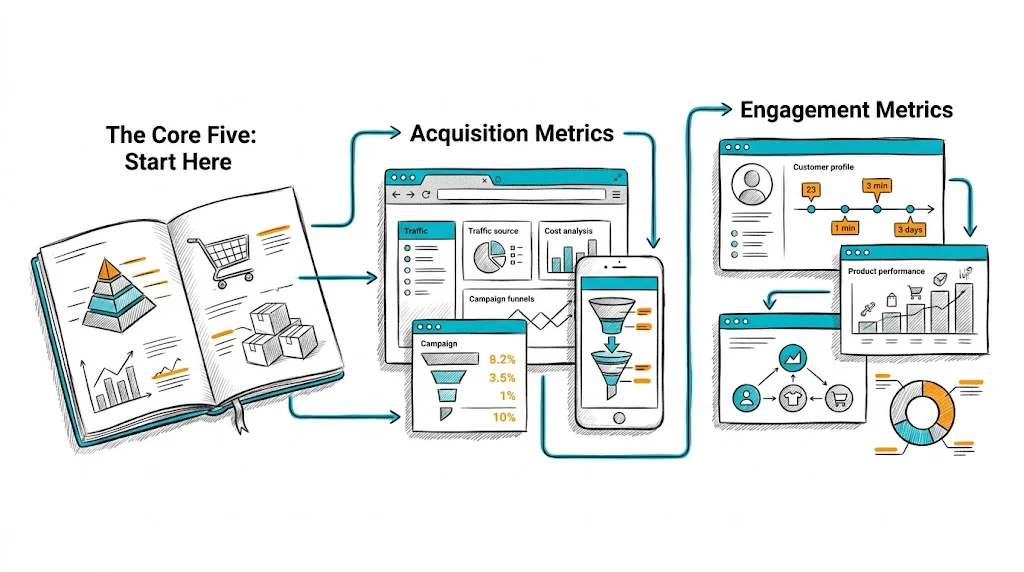
If you track nothing else, track these five.
Formula: (Orders ÷ Sessions) × 100
What it tells you: The percentage of visitors who buy. This is the headline metric of CRO.
Benchmark: 1–3% average; 3–5% for top D2C performers; 5%+ for CRO-mature brands.
Segment it: Overall CVR is almost meaningless. Segment by traffic source, device, new vs. returning visitor, and landing page. The differences between these segments reveal exactly where to focus.
Formula: Total Revenue ÷ Number of Orders
What it tells you: How much each customer spends per order. Lifting AOV without lifting ad spend is pure margin improvement.
Benchmark: Varies dramatically by category. Track your own trend — are you moving it up month over month?
How to improve: Upsells, cross-sells, free shipping thresholds, bundle offers. See Shopify Upsell & Cross-Sell Strategies.
Formula: Total Revenue ÷ Total Visitors
What it tells you: Revenue per visitor combines CVR and AOV into a single number that represents how efficiently you're monetising traffic. This is the primary metric for CRO experiments — it captures both conversion rate changes and order value changes.
Why it matters: A test that lifts CVR by 5% but drops AOV by 10% looks like a win on CVR alone but is a loss on RPV. Always evaluate tests by RPV.
Formula: 1 − (Completed Purchases ÷ Shopping Carts Created)
What it tells you: The percentage of shoppers who add to cart but never buy. Cart abandonment rate averages 70–80% — the gap between this and 100% is your recovery opportunity.
Benchmark: Below 65% is excellent; 65–75% is typical; above 80% indicates significant checkout friction.
Formula: Average Order Value × Purchase Frequency × Customer Lifespan
What it tells you: Customer lifetime value is the total revenue expected from a customer over their entire relationship with your brand. CLV determines how much you can profitably spend to acquire a customer.
Why it matters for CRO: CRO programmes that increase first-order CVR but decrease repeat purchase rate are destroying CLV. Always track CLV alongside CVR.
Formula: Total Marketing Spend ÷ Number of New Customers
What you spend to acquire each new customer. Should be measured against CLV: if CAC > CLV/3, the business is unprofitable at scale.
Segment CVR by source: paid social, organic search, email, WhatsApp, direct. Each source brings different visitor quality. Understanding which source converts best tells you where to invest more.
Returning visitors typically convert 2–3x better than new visitors because they already trust the brand. If your returning visitor CVR is low, your loyalty and retention programme needs work.
Organic visitors often have higher intent (they searched for your product). If paid traffic converts at 0.5% and organic at 2%, you're overpaying for low-quality traffic.
Formula: (Single-Page Sessions ÷ Total Sessions) × 100
Bounce rate measures the percentage of visitors who leave after viewing only one page. A high bounce rate on your homepage suggests a relevance or speed problem. A high bounce rate on a product page suggests a trust or information problem.
Benchmark: Under 40% is good; 40–60% is average; above 70% needs investigation.
More pages per session suggests higher engagement — but not always higher intent. Shoppers who browse 10 pages without buying may be lost, not engaged. Track this alongside CVR.
Longer session duration on product pages suggests high engagement with your content. Short sessions with high bounce rates suggest poor relevance.
What percentage of visitors scroll to the bottom of your product page? If most visitors never see your reviews (which are often at the bottom), move them up.
Formula: (Add-to-Cart Events ÷ Product Page Views) × 100
Add-to-cart rate is the most sensitive product page metric. A small change in this number — moving social proof above the fold, adding a FAQ, rewriting CTA copy — has a direct impact on overall CVR.
Benchmark: 5–10% is typical; top performers achieve 10–15% for high-intent traffic.
What percentage of shoppers who created a cart initiated checkout? Below 50% suggests problems in the cart experience — unexpected shipping costs, lack of payment options, or confusing cart UI.
Formula: (Completed Purchases ÷ Checkout Initiations) × 100
Checkout completion rate isolates checkout-specific friction from cart friction. A low rate here points to payment issues, form complexity, or trust deficits at the payment stage.
Benchmark: 60–80% is typical for optimised checkouts.
High return rates eat margin and signal product-expectation mismatch. If shoppers buy expecting one thing and receive another, your product page descriptions, images, or sizing information are creating false expectations.
What percentage of customers make a second purchase within 90 days? For subscription-driven categories (supplements, beauty), this should be above 30%. Below 15% suggests weak retention.
Average number of purchases per customer per year. Increasing purchase frequency without increasing CAC is one of the most efficient growth levers available.
Would your customers recommend you? NPS is a leading indicator of CLV and word-of-mouth growth.
Revenue minus cost of goods sold (COGS) per order. If your gross margin is below 40% and you're running paid acquisition, you're likely unprofitable at scale.
Not all traffic sources are equally valuable. Calculate revenue per visitor by source (RPV = Revenue from source ÷ Sessions from source) to identify your most valuable channels.
Calculate RPV separately for mobile and desktop. The gap between them is your mobile optimisation opportunity.
The ratio of COD to prepaid orders is a proxy for trust and payment preference. A high COD rate increases operational costs (returns, RTO) and cash flow risk. Track this by segment — Tier 2 vs. metro, new vs. returning — to personalise your checkout strategy.
For Indian D2C, RTO is a critical profitability metric. When a COD order is undelivered and returned, you bear full shipping cost both ways plus the cost of goods during transit. If your RTO rate is above 15%, you have a fulfilment, targeting, or product-expectation problem.
You don't need to track all 25 simultaneously at first. Build a tiered dashboard:
Weekly review (operational): Sessions, CVR, AOV, cart abandonment rate, revenue by source
Monthly review (strategic): Customer lifetime value, repeat purchase rate, gross margin per order, COD/prepaid split, RTO rate
Quarterly review (programme): All 25 KPIs, trend analysis, year-over-year comparison
Related reading: Ecommerce Conversion Funnel: Optimize Every Stage | How to Scale an Ecommerce Business in 2026 | Increase Ecommerce Revenue Without More Traffic